I am using c8run 8.8 on windows, and c8run was working fine, and after stopping using c8run.exe stop, and restarting my machine, when trying c8run.exe start, I noticed that elasticSearch won’t start, and I get the below error:
[2025-10-15T20:21:47,619][INFO ][o.e.c.r.a.AllocationService] [LPNCGOLY909909] current.health=“YELLOW” message=“Cluster health status changed from [RED] to [YELLOW] (reason: [shards started [[camunda-role-8.8.0_][0], [tasklist-task-8.8.0_][0]]]).” previous.health=“RED” reason=“shards started [[camunda-role-8.8.0_][0], [tasklist-task-8.8.0_][0]]”
so I tried Explain the shard allocations API as follows:
GET /_cluster/allocation/explain
response was:
{
"note": "No shard was specified in the explain API request, so this response explains a randomly chosen unassigned shard. There may be other unassigned shards in this cluster which cannot be assigned for different reasons. It may not be possible to assign this shard until one of the other shards is assigned correctly. To explain the allocation of other shards (whether assigned or unassigned) you must specify the target shard in the request to this API. See https://www.elastic.co/guide/en/elasticsearch/reference/8.17/cluster-allocation-explain.html for more information.",

"index": "operate-decision-instance-8.3.0\_",

"shard": 0,

"primary": **false**,

"current_state": "unassigned",

"unassigned_info": {

    "reason": "CLUSTER_RECOVERED",

    "at": "2025-10-15T17:21:41.254Z",

    "last_allocation_status": "no_attempt"

},

"can_allocate": "no",

"allocate_explanation": "Elasticsearch isn't allowed to allocate this shard to any of the nodes in the cluster. Choose a node to which you expect this shard to be allocated, find this node in the node-by-node explanation, and address the reasons which prevent Elasticsearch from allocating this shard there.",

"node_allocation_decisions": \[

    {

        "node_id": "M-APbVXXSX-lFk11BNfk_w",

        "node_name": "LPNCGOLY909909",

        "transport_address": "127.0.0.1:9300",

        "node_attributes": {

            "transform.config_version": "10.0.0",

            "xpack.installed": "true",

            "ml.config_version": "12.0.0"

        },

        "roles": \[

            "data",

            "data_cold",

            "data_content",

            "data_frozen",

            "data_hot",

            "data_warm",

            "ingest",

            "master",

            "ml",

            "remote_cluster_client",

            "transform"

        \],

        "node_decision": "no",

        "deciders": \[

            {

                "decider": "same_shard",

                "decision": "NO",

                "explanation": "a copy of this shard is already allocated to this node \[\[operate-decision-instance-8.3.0\_\]\[0\], node\[M-APbVXXSX-lFk11BNfk_w\], \[P\], s\[STARTED\], a\[id=vlbhbIvSSJaFdrla5Kz9jA\], failed_attempts\[0\]\]"

            }

        \]

    }

\]
}
The camunda health is as follows:
{
“cluster_name”: “elasticsearch”,
“status”: “yellow”,
“timed_out”: false,
“number_of_nodes”: 1,
“number_of_data_nodes”: 1,
“active_primary_shards”: 46,
“active_shards”: 46,
“relocating_shards”: 0,
“initializing_shards”: 0,
“unassigned_shards”: 34,
“unassigned_primary_shards”: 0,
“delayed_unassigned_shards”: 0,
“number_of_pending_tasks”: 0,
“number_of_in_flight_fetch”: 0,
“task_max_waiting_in_queue_millis”: 0,
“active_shards_percent_as_number”: 57.49999999999999
}
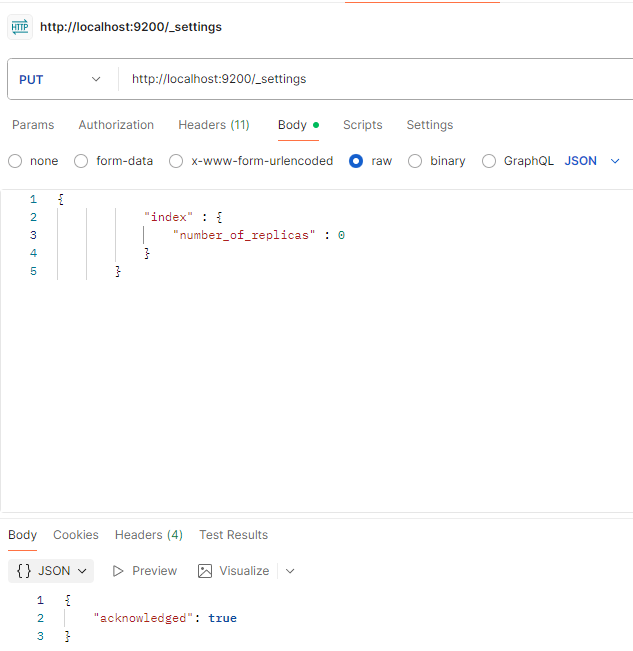
The only way to fix this issue and make camunda run is by changing number of replicas as follows:
curl --location --request PUT ‘``http://localhost:9200/_all/_settings’``
–header ‘Content-Type: application/json’
–data ‘{
“index”: {
“number_of_replicas”: 0
}
}’
Please advise, why I am facing this issue, and if there’s any configuration I can add to fix it permanently.