Hello,
I am observing a memory leak on the camunda engine when i disabled the history level and set it to “audit”, (I also execute the database request to change it)
I upgrade the camunda version to 7.20 and the spring boot version to 3.1.7 but i still have the issue
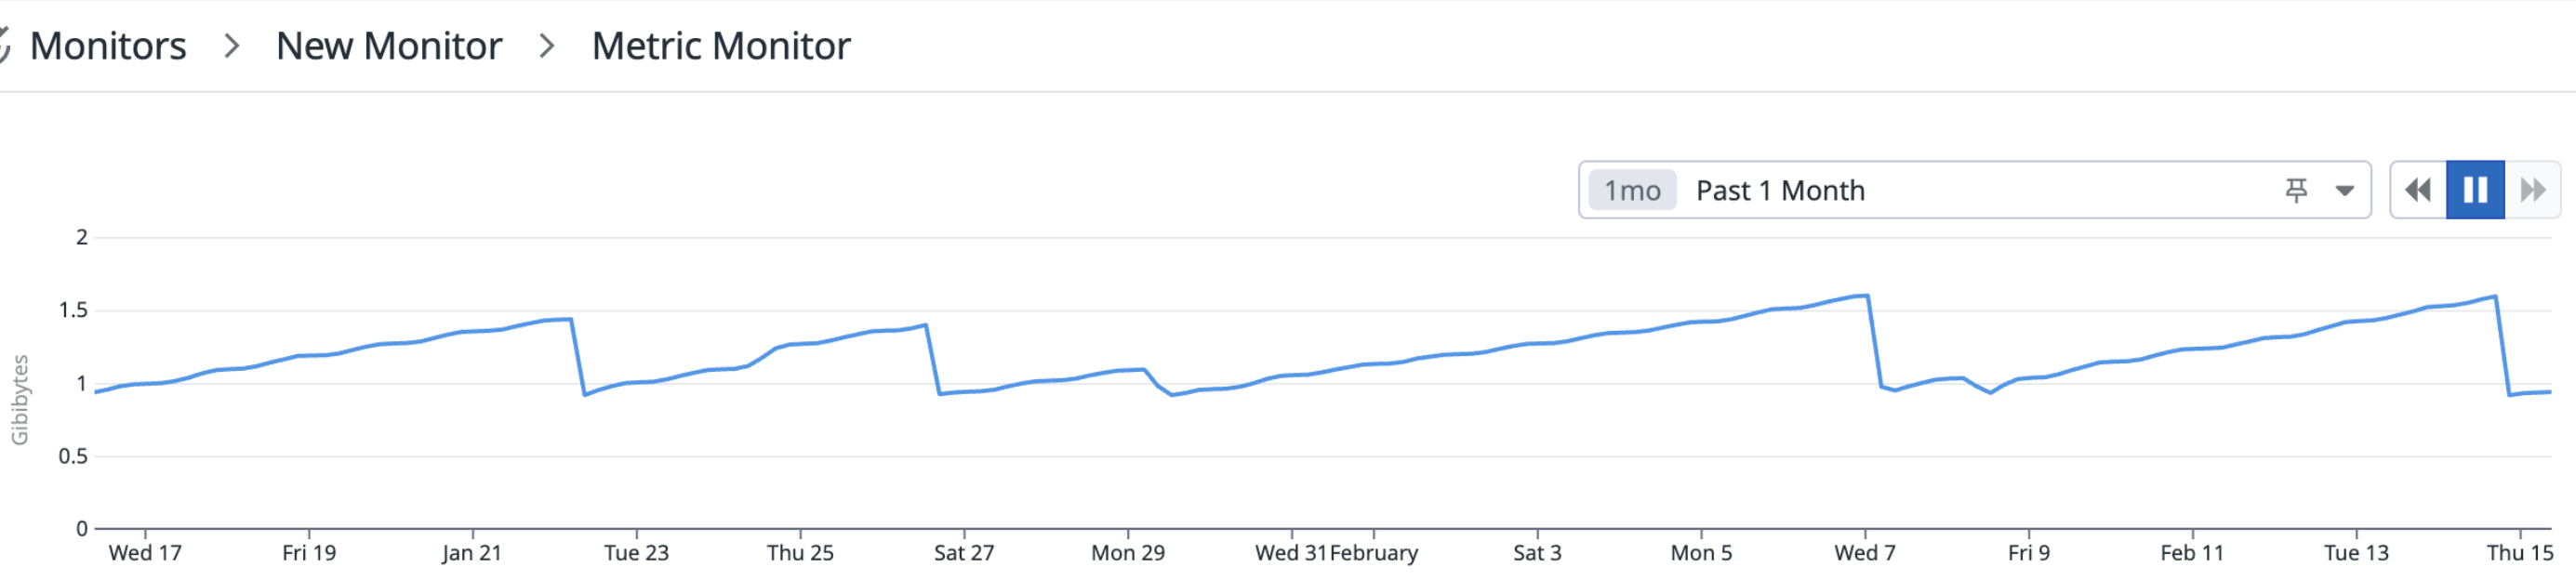
Here we can see a datadog monitor, I need to restart the camunda pod every week to avoid an OOM
Hello my friend!
What level of history were you using before switching to “Audit”?
Hello @WilliamR.Alves, thank you for your return.
Before “Audit” i was using “full” as history level
What version of JDK are you using? What is the version of Camunda and JDK before upgrade to 7.20?
I was using camunda 16 and java 17 before the migration and i am using java 17 with camunda 7.20
what would be the version of Spring boot framework before and after upgrade
Before it was 2.7.11 and after 3.1.7
Are you running the SQL scripts to upgrade your Camunda version from 7.16 to 7.20?
Check if you have performed all the necessary steps for Camunda version migration as described in the official documentation as in the link below:
In the menu on the left, you can check all the migration steps… and run them all from 7.16 to 7.20 if you have not performed this process.
As this involves the database, and it is necessary to execute a series of SQL scripts, and Camunda 7 loads its state through the DB, perhaps this could be causing this memory leak because due to possible changes to the tables, the queries may not be running. optimized, and this will cause a memory leak.
William Robert Alves
Yes, I execute all scripts with liquibase for each migration.
I did a heap dump and the biggest object is java.lang.ref.Finalizer , the most accumulated objects inside are linked to postgres database like org.postgresql.core.Field or org.postgresql.core.v3.SimpleQuery
The second biggest one is Camunda BPM Runtime Telemetry Reporter
Perfect!
Is disabling telemetry not an option for you?
It is disabled on the web admin interface
Regarding the ref.Finalizer, if I’m not wrong, it must be some object that the Garbage Collector is not collecting and is being allocated in memory…
Did the memory leak start after the version migration, or was it already there before?
Have any changes been made to the connection pool?
The memory leak starts before the migration, just after the update of the history level as i mentioned above
No change was done to the connection pool
I am also facing the same issue. Camunda 7 does not release the Heap and POD is getting restarted