Hi there, I am playing with self managed Camunda 8.6 and trying to view the stats via Grafana Dashboard elements.
Installed 8.6 on Mac-mini-os. KIND cluster.
Installed Prometheus and Grafana
I included Zeebe broker configurations as mentioned in the docs.
ZEEBE_BROKER_EXPERIMENTAL_ROCKSDB_ENABLEACCESSMETRICS=fine
prometheusServiceMonitor.enabled="true"
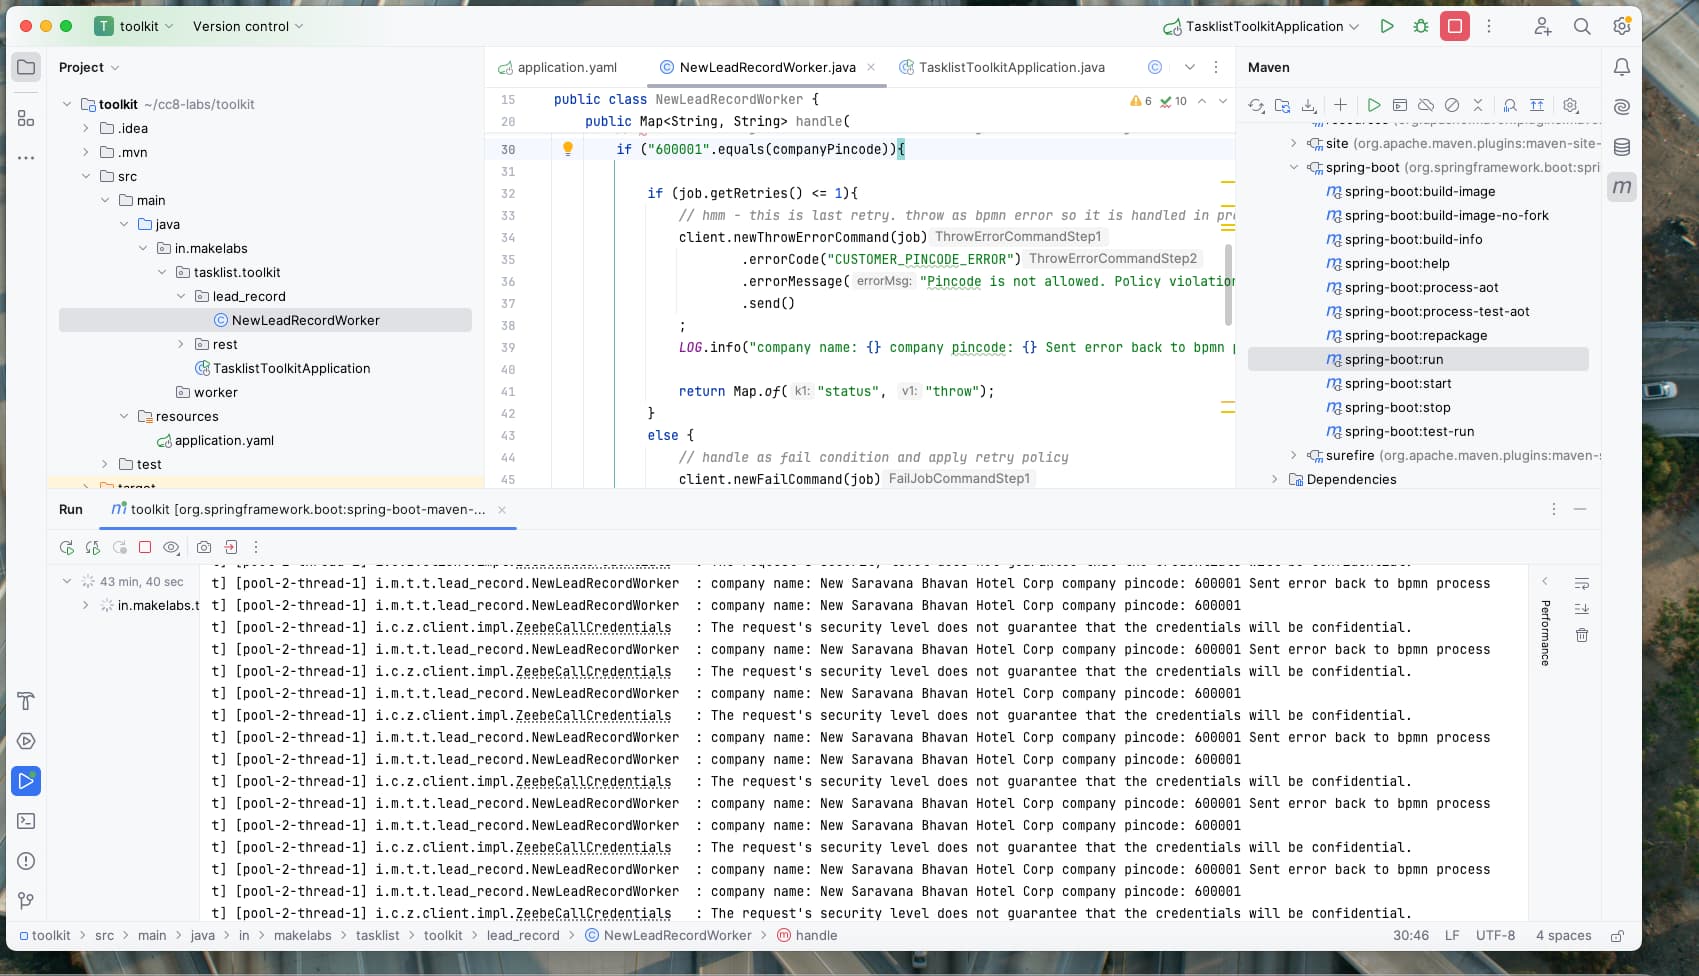
In order to test my env, I created bpmn process that has job worker and error handling with email notification.
I am able to run a dozen instances using web-hook and I can see all of them sending email notifications (via Operate). The emails are delivered as well.
I have two questions w.r.t Grafana Dashboard.
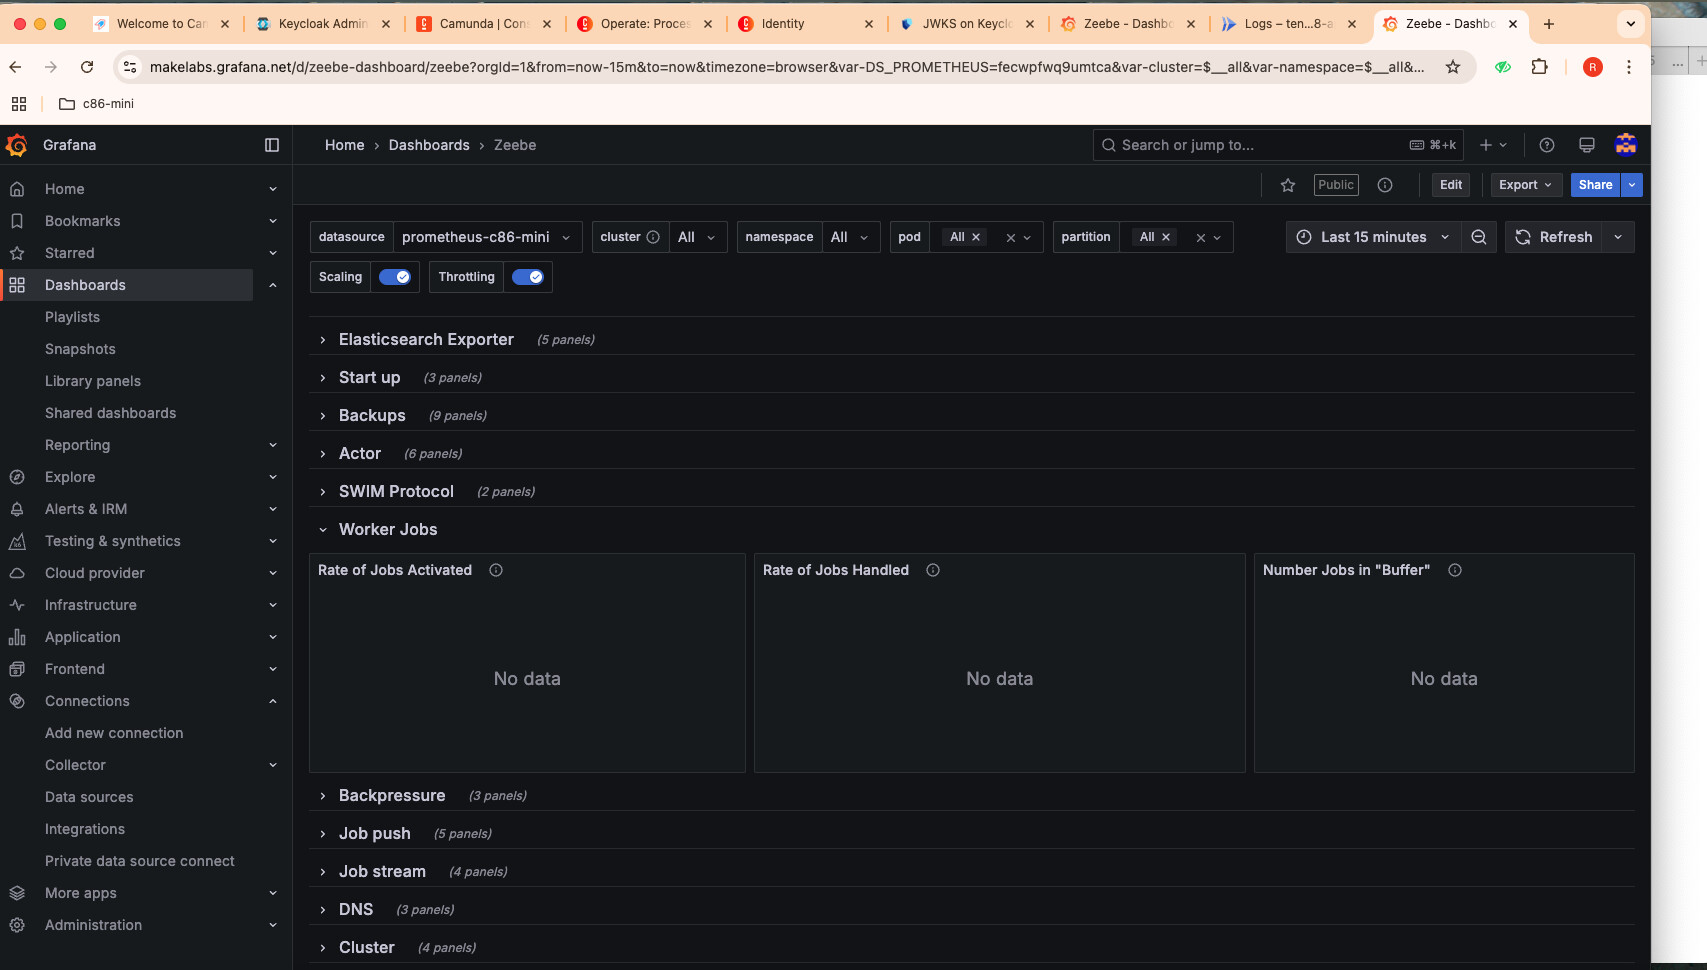
a. My test data throws a BPMN error which is handled in the process def. I was hoping to see these stats reflected on Grafana under “Worker Jobs”.
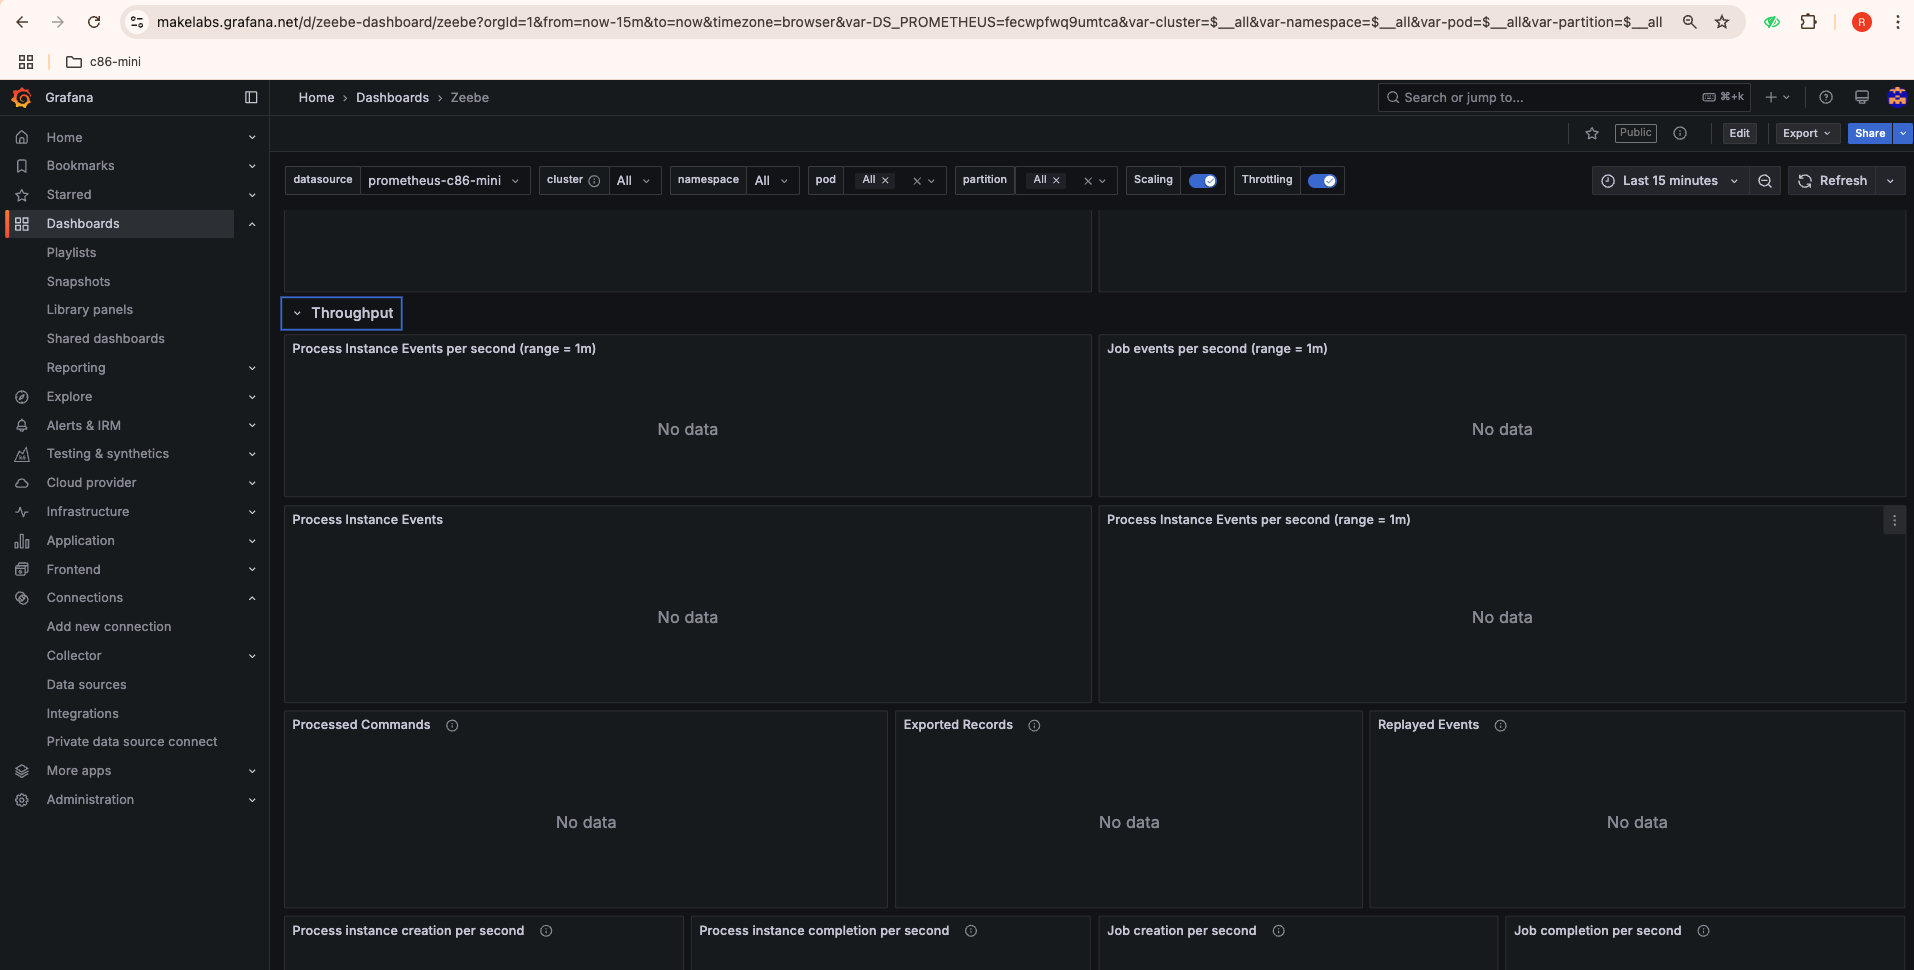
For some reason, the Grafana Dashboard does not show anything - it shows No data. I ran the exercise couple of times, but no luck.

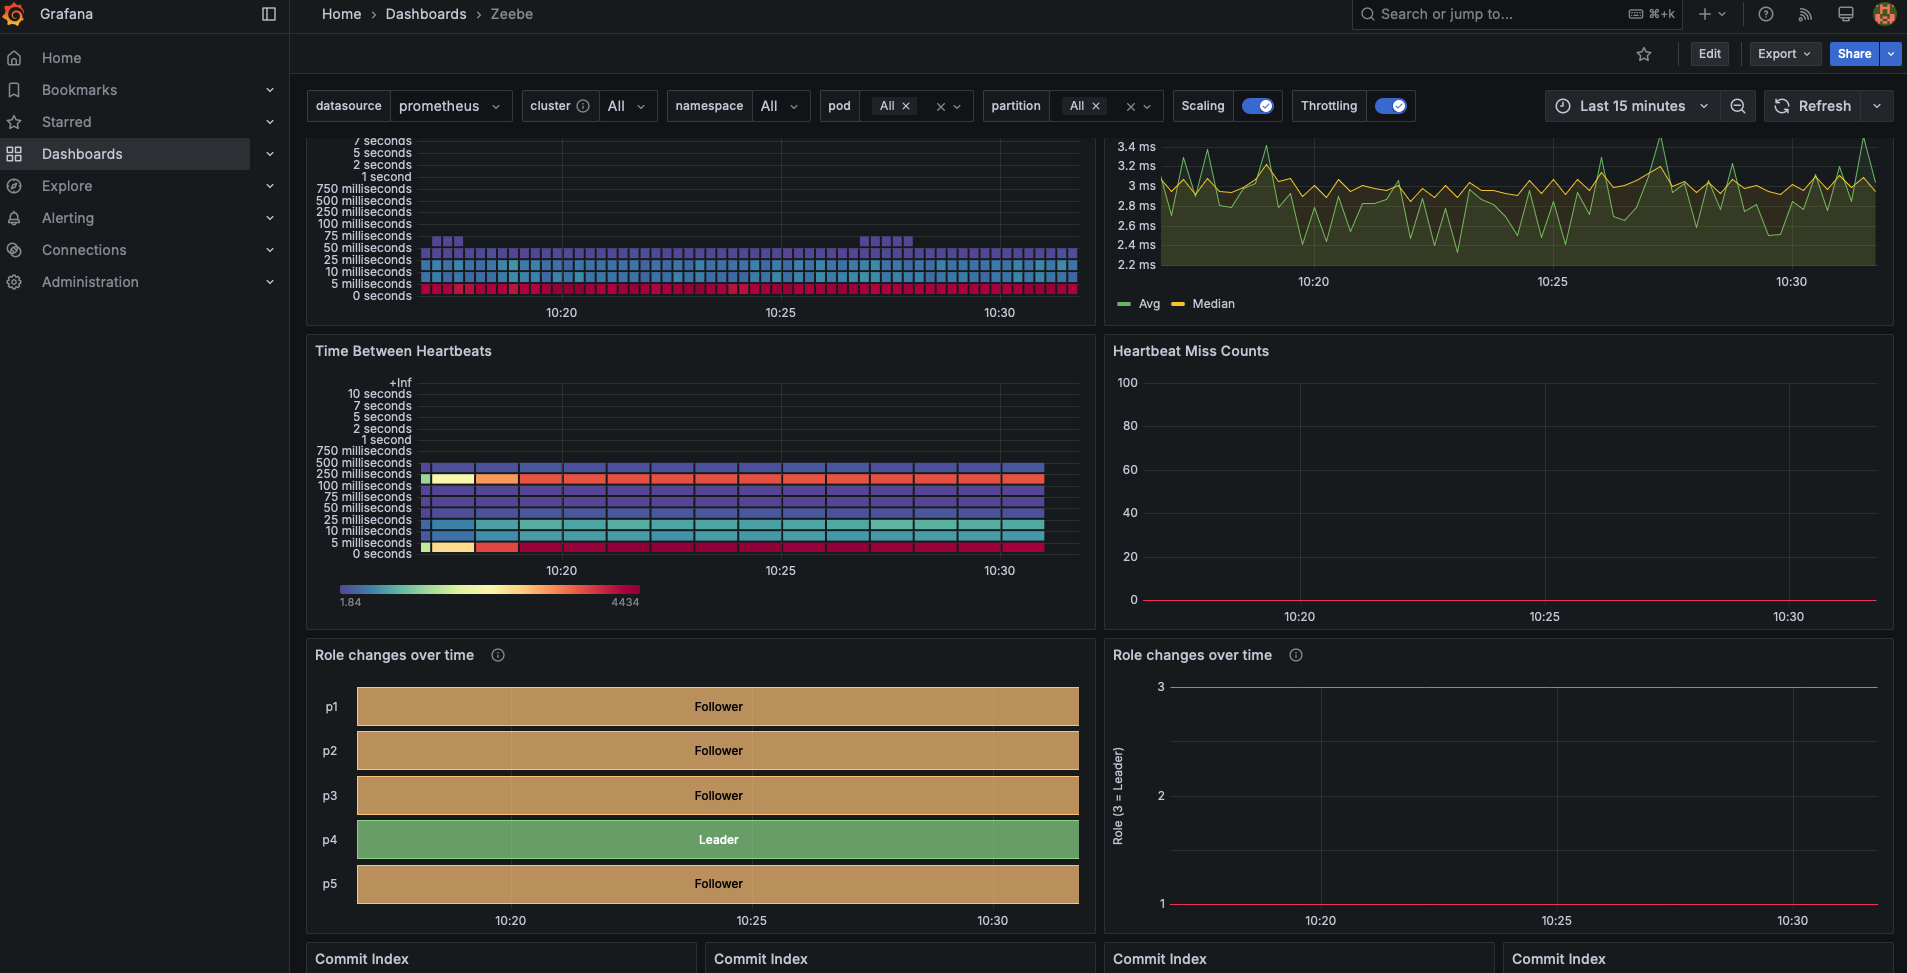
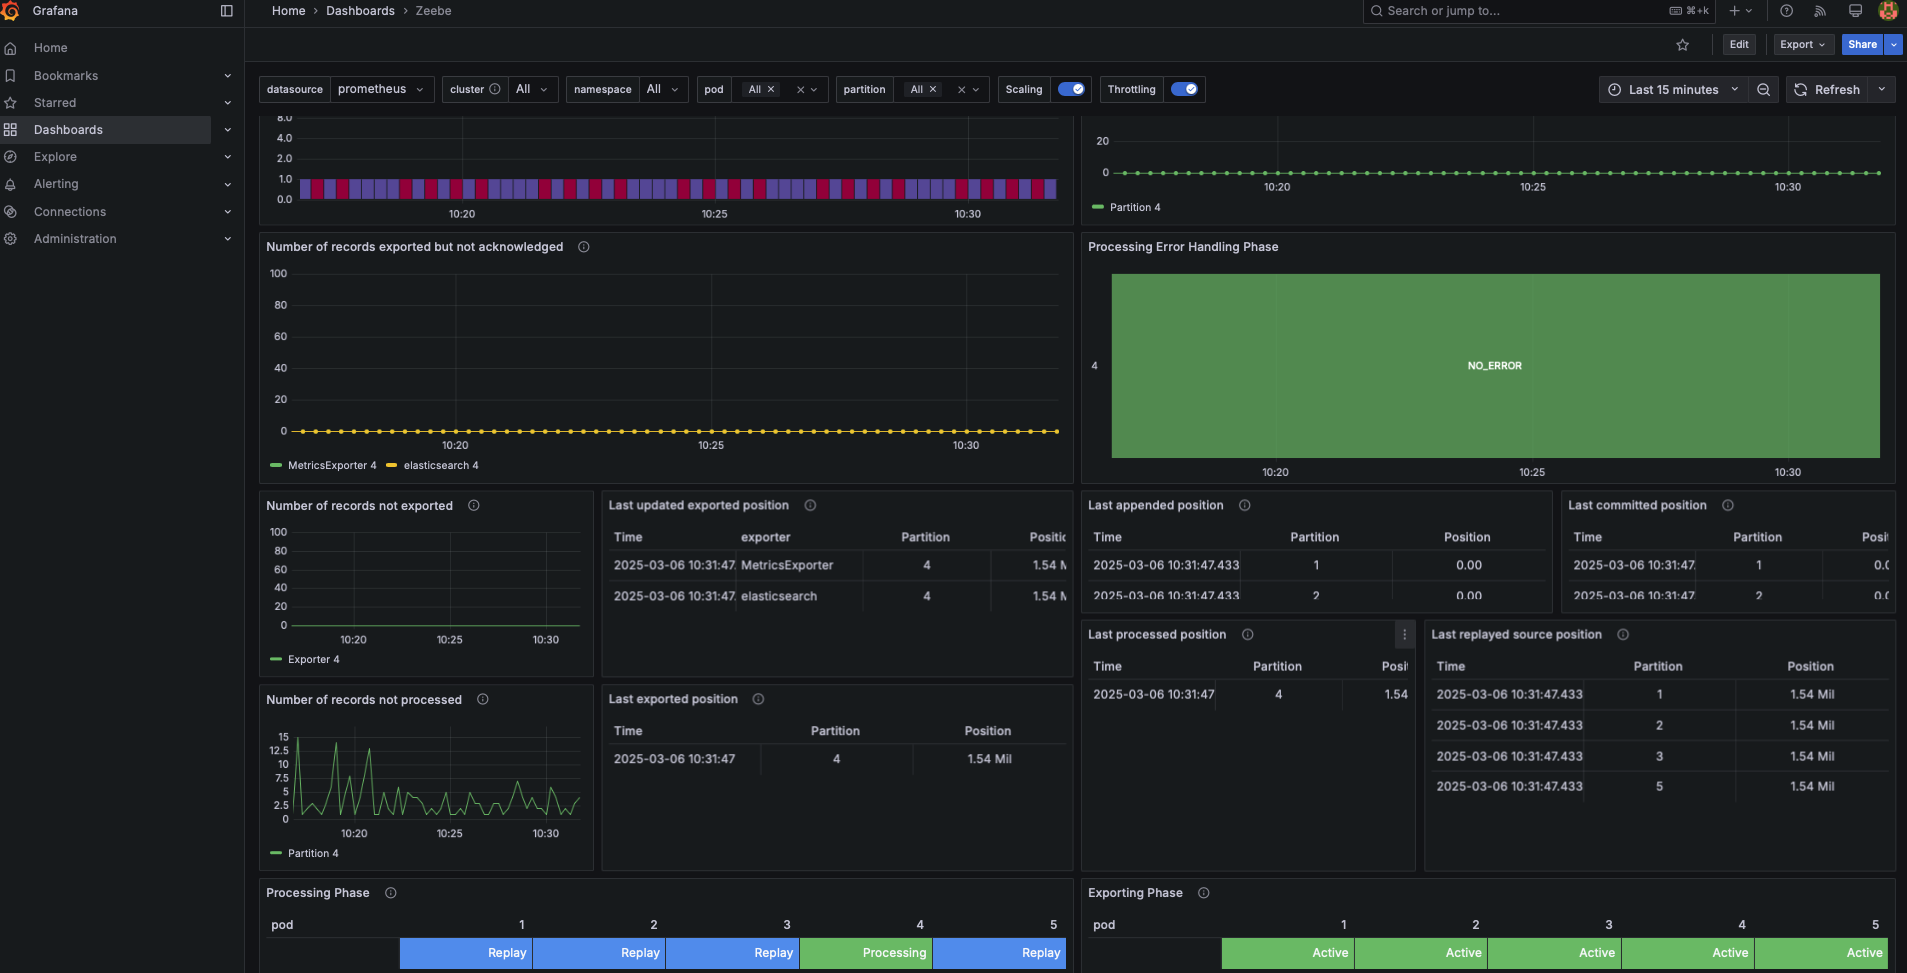
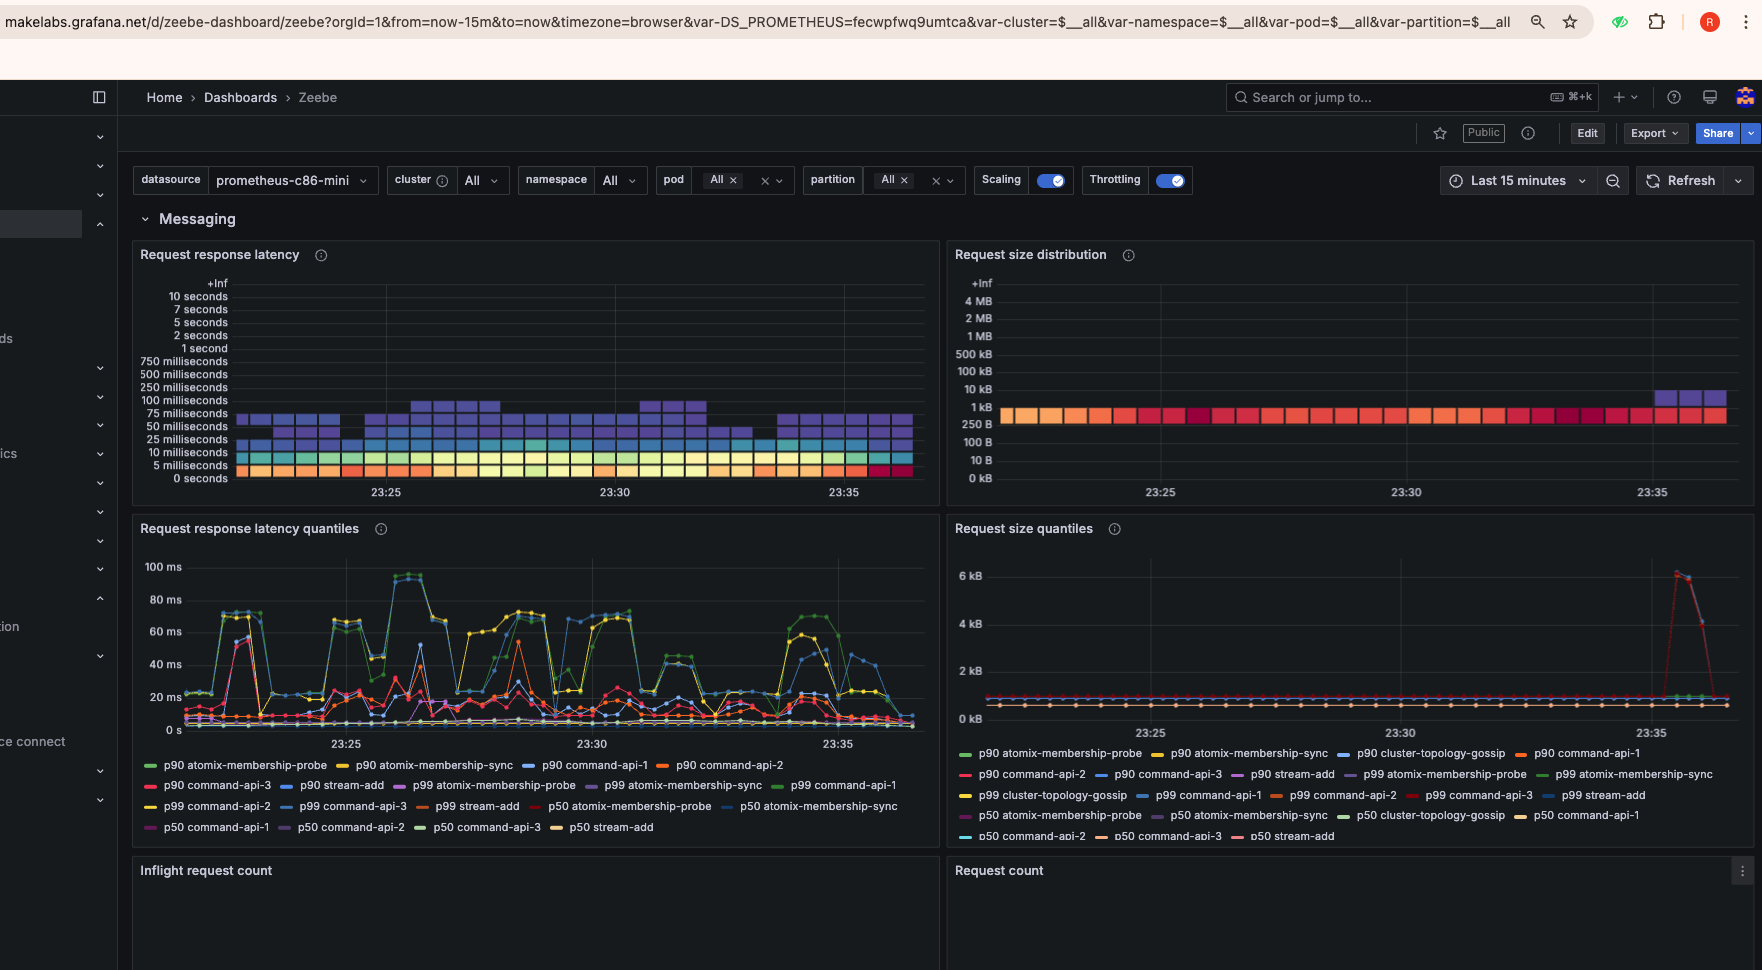
b. In Grafana Dashboard, some of the stats are populated, such as - Messaging, CPU, IO - but a lot of them are empty. I am trying to get to see stats under elements such as Processing Error Handling Phase, Throughput, Latency. These are unfortunately empty - No data.

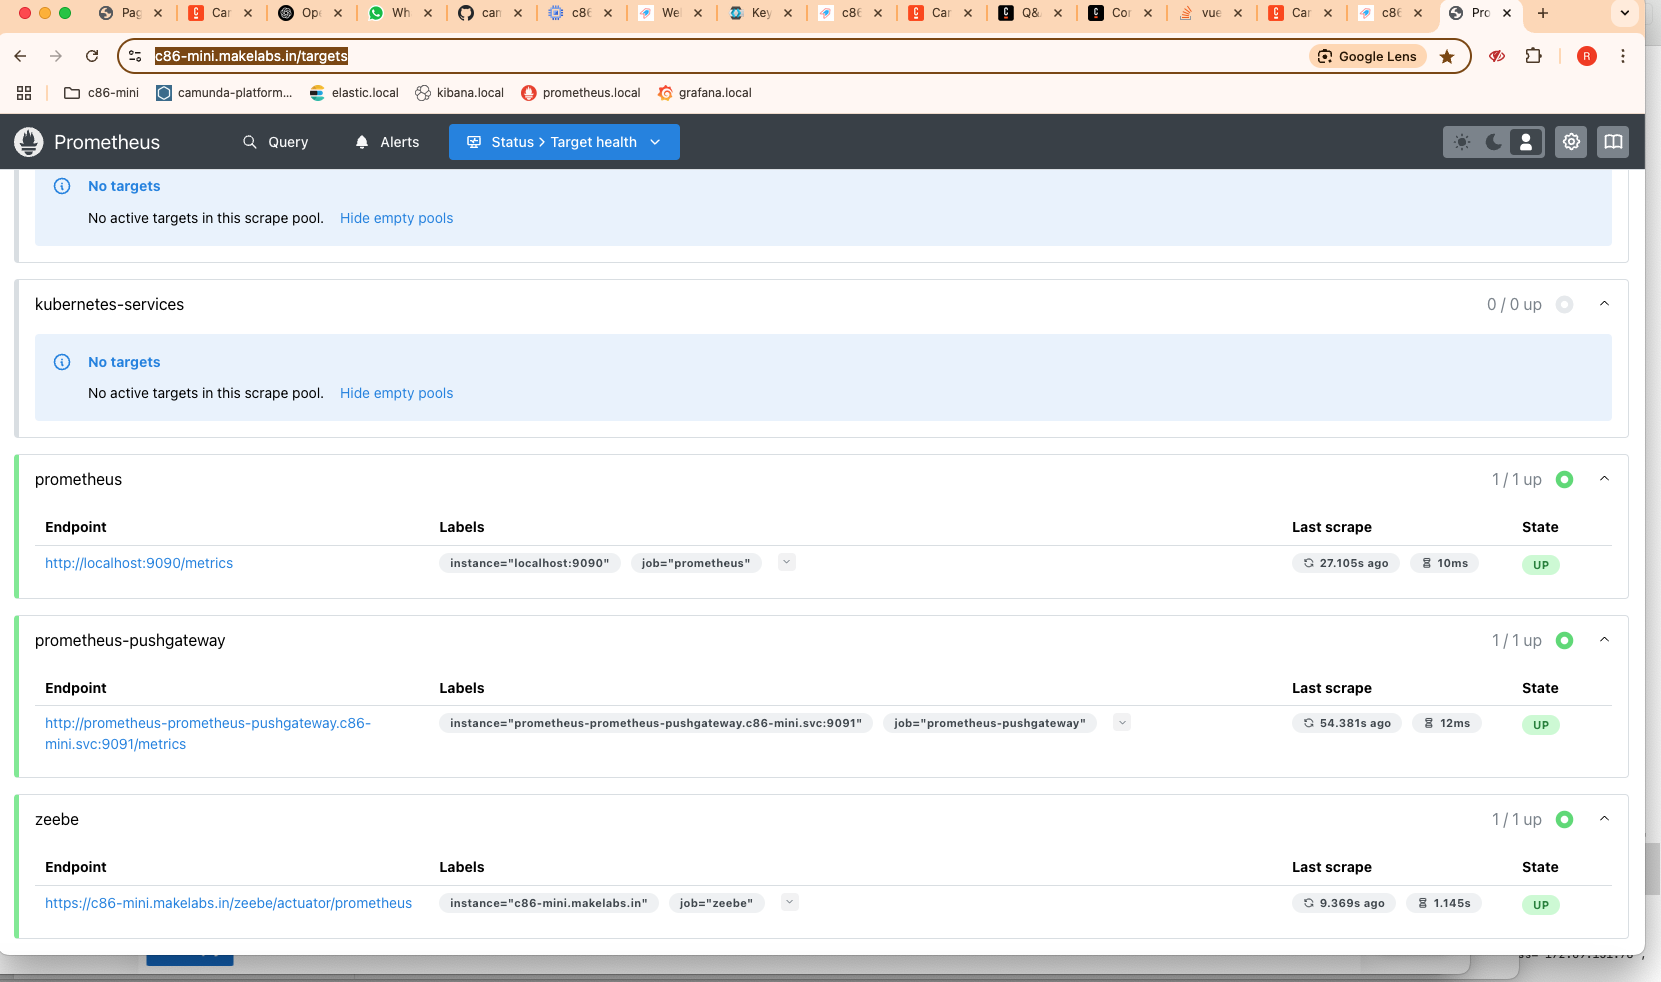
I am suspecting that prometheus configuration perhaps is not configured correctly.
When I ran the “helm install …” command, I do see in the stdout log messages below summary. Note prometheus monitor flag is false. I am not able to figure out how to get this flag set to true.
$ helm install camunda camunda/camunda-platform -f values-combined-ingress.yaml -f values-connectors-env.yaml
Installed Services:
- Console:
- Enabled: true
- Docker Image used for Console: camunda/console:8.6.44
- Zeebe:
- Enabled: true
- Docker Image used for Zeebe: camunda/zeebe:8.6.7
- Zeebe Cluster Name: “camunda-zeebe”
- Prometheus ServiceMonitor Enabled: false
- Operate:
- Enabled: true
- Docker Image used for Operate: camunda/operate:8.6.7
- Tasklist:
- Enabled: true
- Docker Image used for Tasklist: camunda/tasklist:8.6.7
- Optimize:
- Enabled: true
- Docker Image used for Optimize: camunda/optimize:8.6.4
- Connectors:
- Enabled: true
- Docker Image used for Connectors: camunda/connectors-bundle:8.6.6
- Identity:
- Enabled: true
- Docker Image used for Identity: camunda/identity:8.6.7
- Keycloak: camunda/keycloak:25.0.6
- Web Modeler:
- Enabled: false
- Elasticsearch:
- Enabled: true
- Docker Image used for Elasticsearch: bitnami/elasticsearch:8.15.4
I am attaching the files for your kind review.
values yml
bpmn file + dmn file + form
Here is the job worker application.yml file.
spring:
  application:
    name: tasklist-toolkit

server:
  port: 9010

camunda:
  client:
    mode: self-managed
    zeebe:
      enabled: true
      grpc-address: http://127.0.0.1:26500
      rest-address: http://127.0.0.1:8088
    auth:
      client-id: rope-toolkit-app
      client-secret: cryptic-data
      issuer: https://c86-mini.makelabs.in/auth/realms/camunda-platform/protocol/openid-connect/token
The job worker is in fact processing all the transactions.
Kindly advise.
lead-to-opportunity-with-dmn.bpmn (20.7 KB)
lead-to-opportunity-with-webhook-Form.form (1.9 KB)
new-lead-approval.dmn (3.2 KB)
values-combined-ingress.yaml (5.0 KB)