Hi all,
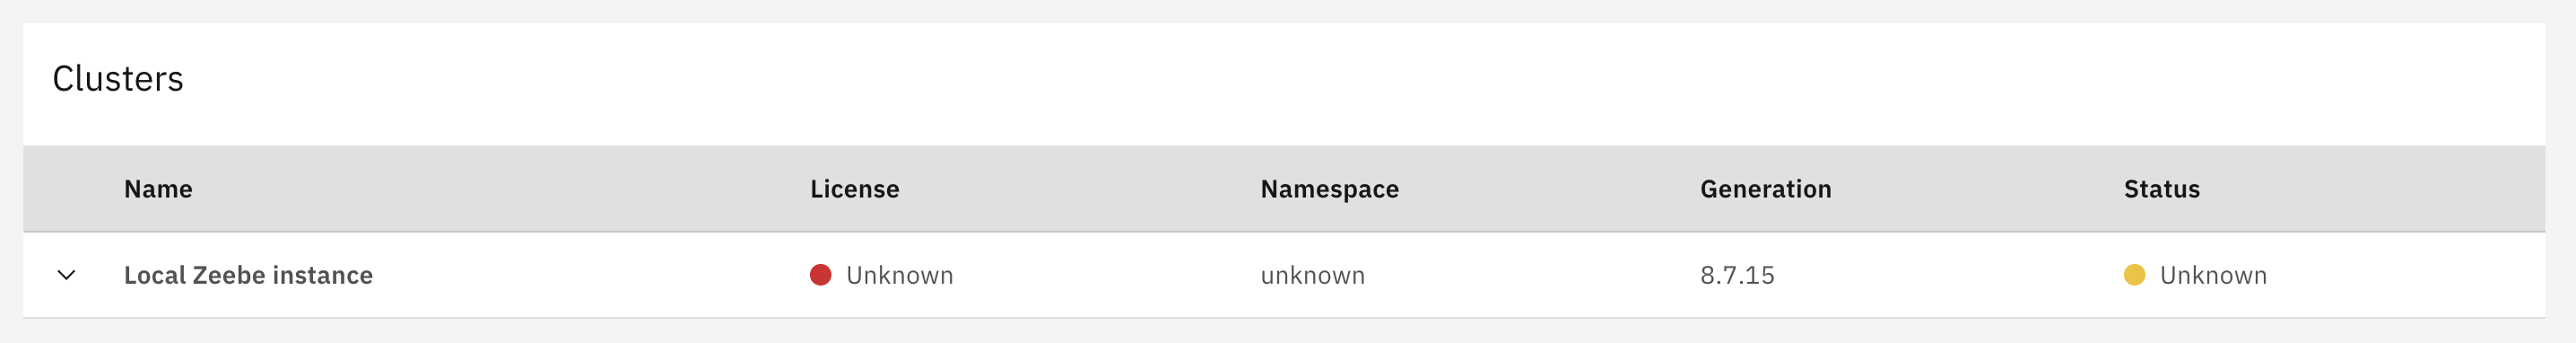
I’m running Camunda 8.7 with Docker Compose and I added Console so it starts with the rest of the platform. Authentication via Microsoft Entra ID works (OIDC v2 tokens). However, Console shows my cluster tile but:
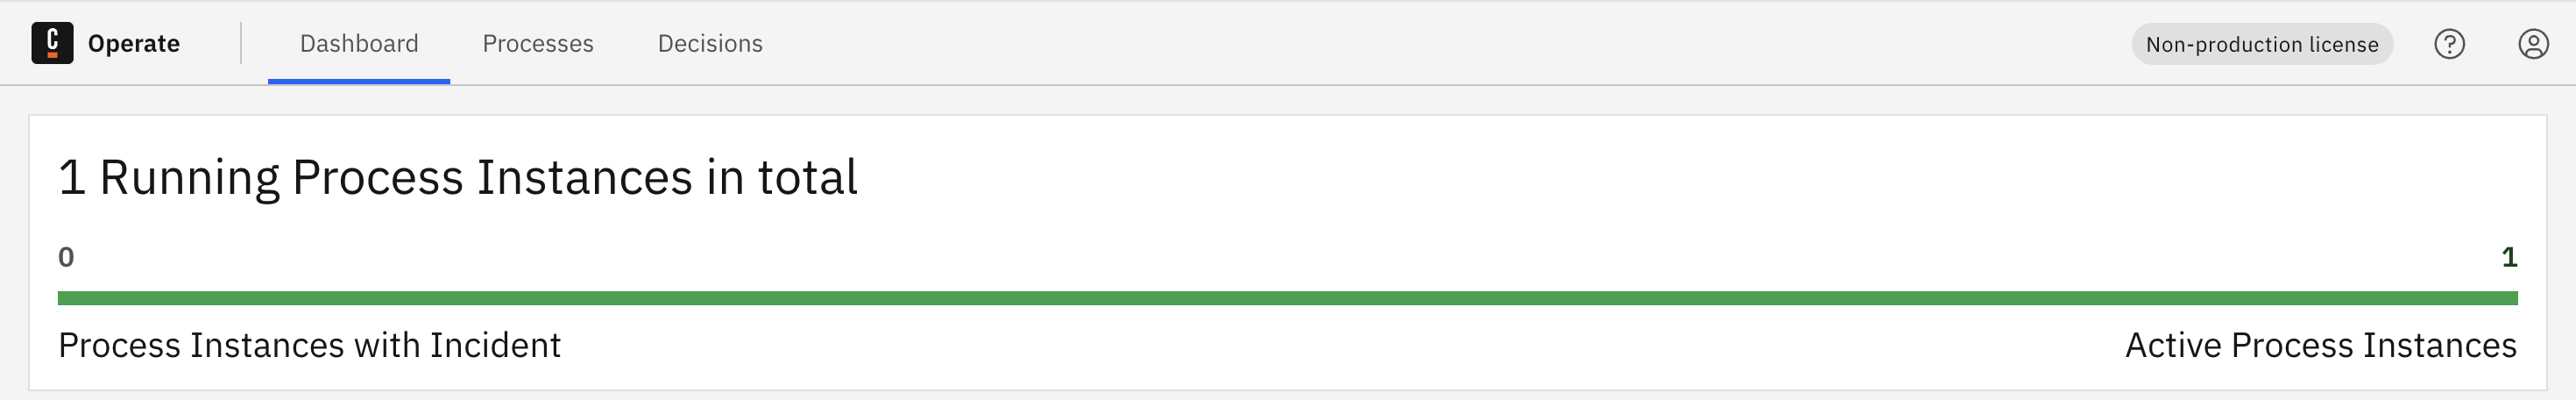
In Operate and Tasklist I do see real data, so the runtime is fine. I already enabled the “Console ping” in Zeebe (and even in Operate/Tasklist for testing), which made the cluster appear—but no health/usage.
Yet in Operate we have:
What I’m running
Console service
console:
  image: camunda/console:8.7.90
  container_name: console
  ports:
    - "8087:8080"          # Console UI
    - "9100:9100"          # health/metrics
  environment:
    NODE_ENV: production

    # Test license only
    CAMUNDA_LICENSE_KEY_IS_TEST: "true"

    # OIDC via Microsoft Entra ID (through Identity)
    CAMUNDA_IDENTITY_TYPE: MICROSOFT
    CAMUNDA_IDENTITY_BASE_URL: http://identity:8084
    CAMUNDA_IDENTITY_ISSUER: https://login.microsoftonline.com/<tenant-id>/v2.0
    CAMUNDA_IDENTITY_ISSUER_BACKEND_URL: https://login.microsoftonline.com/<tenant-id>/v2.0
    CAMUNDA_IDENTITY_CLIENT_ID: <client-id>
    CAMUNDA_IDENTITY_CLIENT_SECRET: <redacted>
    CAMUNDA_IDENTITY_AUDIENCE: <client-id>
    SPRING_PROFILES_ACTIVE: oidc

    # Public URL of Console (as seen by the browser)
    CAMUNDA_CONSOLE_REDIRECT_URL: "https://<my-console-domain>"
    CAMUNDA_CONSOLE_REDIRECT_TRAILING_SLASH: "true"

    JAVA_TOOL_OPTIONS: -Xms512m -Xmx1g

  healthcheck:
    test: ["CMD", "wget", "-q", "--tries=1", "--spider", "http://localhost:9100/health/readiness"]
    interval: 30s
    timeout: 5s
    retries: 5
    start_period: 30s

  volumes:
    - "./.console:/var/run/config"   # optional config overrides

  depends_on:
    identity:
      condition: service_healthy

  networks:
    - camunda-platform
Zeebe “Console ping”
environment:
  CAMUNDA_CONSOLE_PING_ENABLED: "true"
  CAMUNDA_CONSOLE_PING_ENDPOINT: http://console:8087
  CAMUNDA_CONSOLE_PING_CLUSTERID: local-zeebe
  CAMUNDA_CONSOLE_PING_CLUSTERNAME: "Local Zeebe instance"
  CAMUNDA_CONSOLE_PING_PINGPERIOD: 1h
Observed
-
Cluster tile appears in Console (so ping works)
-
Status = Unknown
-
Process instances / tasks = 0 (despite Operate/Tasklist showing data)
-
Creating clusters from Console isn’t possible
Question
For Camunda 8.7, what is the correct way to connect Console to my self-managed components so that status and usage populate?
Hi @tlmouden,
Looking at your configuration, I can see a couple of issues that are likely causing the “Unknown” status and missing usage data in Console.
Main Issues to Fix
1. Enable Console Telemetry
Your Console configuration is missing the telemetry setting. Console telemetry is opt-in and disabled by default. Add this to your Console environment variables:
CAMUNDA_CONSOLE_TELEMETRY: "online" # or "download" if you prefer manual data collection
2. Fix the Ping Endpoint URL
Your current ping endpoint configuration:
CAMUNDA_CONSOLE_PING_ENDPOINT: http://console:8087
Should likely be the base URL without a specific API path. Based on the documentation, try:
CAMUNDA_CONSOLE_PING_ENDPOINT: http://console:8080
Note that you’re exposing Console on port 8087 externally, but internally it runs on port 8080.
Updated Console Configuration
Here’s your Console service with the necessary additions:
console:
  image: camunda/console:8.7.90
  container_name: console
  ports:
    - "8087:8080"
    - "9100:9100"
  environment:
    NODE_ENV: production

    # Test license only
    CAMUNDA_LICENSE_KEY_IS_TEST: "true"

    # Enable telemetry (REQUIRED for status/usage data)
    CAMUNDA_CONSOLE_TELEMETRY: "online"

    # OIDC via Microsoft Entra ID (through Identity)
    CAMUNDA_IDENTITY_TYPE: MICROSOFT
    CAMUNDA_IDENTITY_BASE_URL: http://identity:8084
    CAMUNDA_IDENTITY_ISSUER: https://login.microsoftonline.com/<tenant-id>/v2.0
    CAMUNDA_IDENTITY_ISSUER_BACKEND_URL: https://login.microsoftonline.com/<tenant-id>/v2.0
    CAMUNDA_IDENTITY_CLIENT_ID: <client-id>
    CAMUNDA_IDENTITY_CLIENT_SECRET: <redacted>
    CAMUNDA_IDENTITY_AUDIENCE: <client-id>
    SPRING_PROFILES_ACTIVE: oidc

    # Public URL of Console (as seen by the browser)
    CAMUNDA_CONSOLE_REDIRECT_URL: "https://<my-console-domain>"
    CAMUNDA_CONSOLE_REDIRECT_TRAILING_SLASH: "true"

    JAVA_TOOL_OPTIONS: -Xms512m -Xmx1g
  # ... rest of your config
Updated Zeebe Ping Configuration
environment:
  CAMUNDA_CONSOLE_PING_ENABLED: "true"
  CAMUNDA_CONSOLE_PING_ENDPOINT: http://console:8080  # Changed from 8087 to 8080
  CAMUNDA_CONSOLE_PING_CLUSTERID: local-zeebe
  CAMUNDA_CONSOLE_PING_CLUSTERNAME: "Local Zeebe instance"
  CAMUNDA_CONSOLE_PING_PINGPERIOD: 1h
Troubleshooting Steps
- Check Console logs after adding telemetry configuration
- Check Zeebe logs for ping-related messages
- Verify network connectivity between containers
- Wait for the ping period (1 hour) or restart services to trigger immediate ping
The fact that your cluster tile appears means the ping is working, but without telemetry enabled in Console, the status and usage data won’t be collected or displayed.
References:
Let me know if this resolves the issue or if you see any errors in the logs!
Hi @nathan.loding - I still got no reply for the subject, and I still think it’s weird to have the unknown status, knowing that in the health API of zeebe, it clearly says healthy.
Did I miss something?
Hi @tlmouden - do the logs in the Console container show anything?
Also, please don’t tag users who haven’t participated in a thread yet. This isn’t a priority support channel, it’s a community discussion forum. If you need priority help, you can open a support ticket.