While testing Camunda 8 self-managed, I encountered a strange scenario:
- I created a java application that can start some simple processes and run external tasks. It also has a functionality to start a batch of 100 processes at once to simulate larger loads.
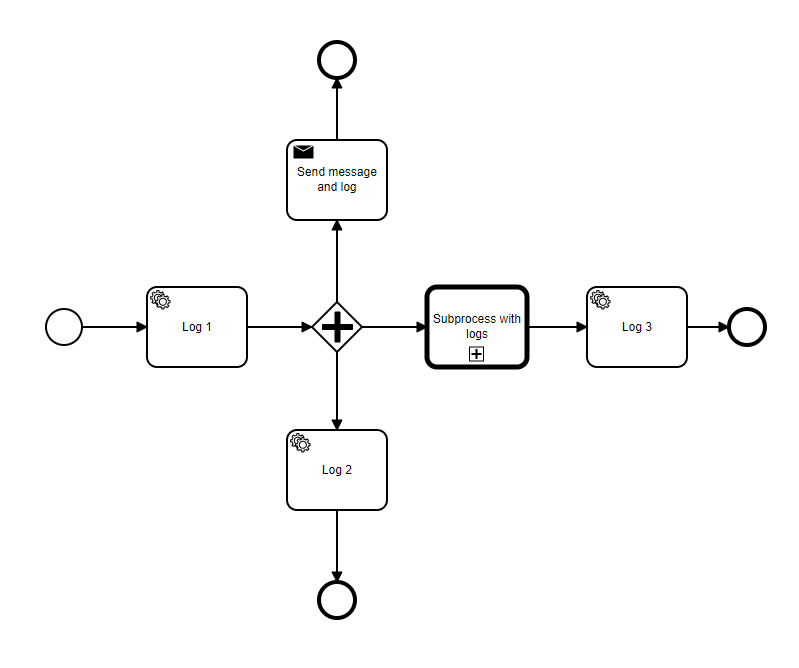
The process can be found below:
The steps log a simple string, then store in a local database the action and continue execution. - When starting a single process, everything works fine and it is completed.
- When starting a batch of processes (tested and reproduced with 10, 100 and 1000), some of them work for a while, then everything breaks and nothing continues execution. In this case, the following error is seen:
RESOURCE_EXHAUSTED: Expected to execute the command on one of the partitions, but all failed; there are no more partitions available to retry. Please try again. If the error persists contact your zeebe operator
Also, some processes seem to be lost and inside the logs there’s a warning:
Ignoring the the error of type 'NOT_FOUND' during {command=class io.camunda.zeebe.client.impl.command.CompleteJobCommandImpl, job={"key":2251799813687745,"type":"log1","customHeaders":{},"processInstanceKey":2251799813687728,"bpmnProcessId":"test_process","processDefinitionVersion":1,"processDefinitionKey":2251799813685250,"elementId":"Activity_0bc6ur9","elementInstanceKey":2251799813687739,"worker":"log1Worker#log1","retries":3,"deadline":1657021289204,"variables":"{\"seed\":100}","variablesAsMap":{"seed":100}}, currentRetryDelay=50}. Job might have been canceled or already completed.
- The docker-compose.yaml file I use is the default one, but with some changes: (added kibana and set to always use latest versions)
# While the Docker images themselves are supported for production usage,
# this docker-compose.yaml is designed to be used by developers to run
# an environment locally. It is not designed to be used in production.
# We recommend to use Kubernetes in production with our Helm Charts:
# https://docs.camunda.io/docs/self-managed/platform-deployment/kubernetes-helm/
# For local development, we recommend using KIND instead of `docker-compose`:
# https://docs.camunda.io/docs/self-managed/platform-deployment/kubernetes-helm/#installing-the-camunda-helm-chart-locally-using-kind

# This is a lightweight configuration with Zeebe, Operate, Tasklist, and Elasticsearch
# See docker-compose.yml for a configuration that also includes Optimize, Identity, and Keycloak.

services:

  zeebe: # https://docs.camunda.io/docs/self-managed/platform-deployment/docker/#zeebe
    image: camunda/zeebe:latest
    container_name: zeebe
    ports:
      - "26500:26500"
      - "9600:9600"
    environment: # https://docs.camunda.io/docs/self-managed/zeebe-deployment/configuration/environment-variables/
      - ZEEBE_BROKER_EXPORTERS_ELASTICSEARCH_CLASSNAME=io.camunda.zeebe.exporter.ElasticsearchExporter
      - ZEEBE_BROKER_EXPORTERS_ELASTICSEARCH_ARGS_URL=http://elasticsearch:9200
      - ZEEBE_BROKER_EXPORTERS_ELASTICSEARCH_ARGS_BULK_SIZE=1
      # allow running with low disk space
      - ZEEBE_BROKER_DATA_DISKUSAGECOMMANDWATERMARK=0.998
      - ZEEBE_BROKER_DATA_DISKUSAGEREPLICATIONWATERMARK=0.999
      - "JAVA_TOOL_OPTIONS=-Xms512m -Xmx512m"
    restart: always
    volumes:
      - zeebe:/usr/local/zeebe/data
    networks:
      - camunda-platform
    depends_on:
      - elasticsearch

  operate: # https://docs.camunda.io/docs/self-managed/platform-deployment/docker/#operate
    image: camunda/operate:latest
    container_name: operate
    ports:
      - "8082:8080"
    environment: # https://docs.camunda.io/docs/self-managed/operate-deployment/configuration/
      - CAMUNDA_OPERATE_ZEEBE_GATEWAYADDRESS=zeebe:26500
      - CAMUNDA_OPERATE_ELASTICSEARCH_URL=http://elasticsearch:9200
      - CAMUNDA_OPERATE_ZEEBEELASTICSEARCH_URL=http://elasticsearch:9200
    networks:
      - camunda-platform
    depends_on:
      - zeebe
      - elasticsearch

  tasklist: # https://docs.camunda.io/docs/self-managed/platform-deployment/docker/#tasklist
    image: camunda/tasklist:latest
    container_name: tasklist
    ports:
      - "8083:8080"
    environment: # https://docs.camunda.io/docs/self-managed/tasklist-deployment/configuration/
      - CAMUNDA_TASKLIST_ZEEBE_GATEWAYADDRESS=zeebe:26500
      - CAMUNDA_TASKLIST_ELASTICSEARCH_URL=http://elasticsearch:9200
      - CAMUNDA_TASKLIST_ZEEBEELASTICSEARCH_URL=http://elasticsearch:9200
    networks:
      - camunda-platform
    depends_on:
      - zeebe
      - elasticsearch

  elasticsearch: # https://hub.docker.com/_/elasticsearch
    image: docker.elastic.co/elasticsearch/elasticsearch:${ELASTIC_VERSION:-7.17.0}
    container_name: elasticsearch
    ports:
      - "9200:9200"
      - "9300:9300"
    environment:
      - bootstrap.memory_lock=true
      - discovery.type=single-node
      # allow running with low disk space
      - cluster.routing.allocation.disk.threshold_enabled=false
      - "ES_JAVA_OPTS=-Xms512m -Xmx512m"
    ulimits:
      memlock:
        soft: -1
        hard: -1
    restart: always
    healthcheck:
      test: [ "CMD-SHELL", "curl -f http://localhost:9200/_cat/health | grep -q green" ]
      interval: 30s
      timeout: 5s
      retries: 3
    volumes:
      - elastic:/usr/share/elasticsearch/data
    networks:
      - camunda-platform
  kibana:
    container_name: kibana
    image: docker.elastic.co/kibana/kibana:7.11.0
    environment:
      - ELASTICSEARCH_HOSTS=http://elasticsearch:9200
    networks:
      - camunda-platform
    depends_on:
      - elasticsearch
    ports:
      - 5601:5601

volumes:
  zeebe:
  elastic:

networks:
  camunda-platform:
I also performed similar tests on version 7, and everything seemed fine for 1000+ processes started at once.