I am using self-managed Camunda version 8.5
and in the operate this error is thrown and the operate is stuck for long time and the new process instances doesn’t be fetched.
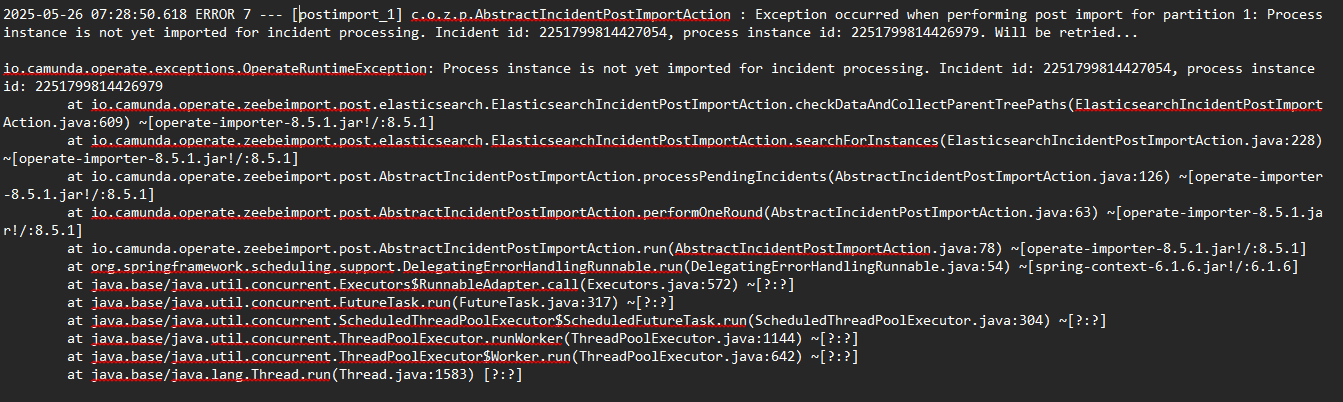
Exception occurred when performing post import for partition 1: Process instance is not yet imported for incident processing. Incident id: 2251799814427054, process instance id: 2251799814426979. Will be retried…
and as we debugged the Zeebe and Elasticsearch logs there is no error thrown in the logs.
Hi @Mohamed_Ahmed_Mohame , Even Im facing the same issue
If you have the solution, Please reply.
Couldn’t able to find the solution
2025-06-05 14:13:38.978 ERROR 905615 --- [   postimport_1] c.o.z.p.AbstractIncidentPostImportAction : Exception occurred when performing post import for partition 1: Process instance is not yet imported for incident processing. Incident id: 2251799877610115, process instance id: 2251799877610002. Will be retried...

io.camunda.operate.exceptions.OperateRuntimeException: Process instance is not yet imported for incident processing. Incident id: 2251799877610115, process instance id: 2251799877610002
	at io.camunda.operate.zeebeimport.post.elasticsearch.ElasticsearchIncidentPostImportAction.checkDataAndCollectParentTreePaths(ElasticsearchIncidentPostImportAction.java:609) ~[operate-importer-8.5.7.jar!/:8.5.7]
	at io.camunda.operate.zeebeimport.post.elasticsearch.ElasticsearchIncidentPostImportAction.searchForInstances(ElasticsearchIncidentPostImportAction.java:228) ~[operate-importer-8.5.7.jar!/:8.5.7]
	at io.camunda.operate.zeebeimport.post.AbstractIncidentPostImportAction.processPendingIncidents(AbstractIncidentPostImportAction.java:127) ~[operate-importer-8.5.7.jar!/:8.5.7]
	at io.camunda.operate.zeebeimport.post.AbstractIncidentPostImportAction.performOneRound(AbstractIncidentPostImportAction.java:64) ~[operate-importer-8.5.7.jar!/:8.5.7]
	at io.camunda.operate.zeebeimport.post.AbstractIncidentPostImportAction.run(AbstractIncidentPostImportAction.java:79) ~[operate-importer-8.5.7.jar!/:8.5.7]
	at org.springframework.scheduling.support.DelegatingErrorHandlingRunnable.run(DelegatingErrorHandlingRunnable.java:54) ~[spring-context-6.1.10.jar!/:6.1.10]
	at java.base/java.util.concurrent.Executors$RunnableAdapter.call(Executors.java:572) ~[?:?]
	at java.base/java.util.concurrent.FutureTask.run(FutureTask.java:317) ~[?:?]
	at java.base/java.util.concurrent.ScheduledThreadPoolExecutor$ScheduledFutureTask.run(ScheduledThreadPoolExecutor.java:304) ~[?:?]
	at java.base/java.util.concurrent.ThreadPoolExecutor.runWorker(ThreadPoolExecutor.java:1144) ~[?:?]
	at java.base/java.util.concurrent.ThreadPoolExecutor$Worker.run(ThreadPoolExecutor.java:642) ~[?:?]
	at java.base/java.lang.Thread.run(Thread.java:1583) [?:?]