Spring Boot 2.3.1.RELEASE
Camunda Spring Boot 3.4.4
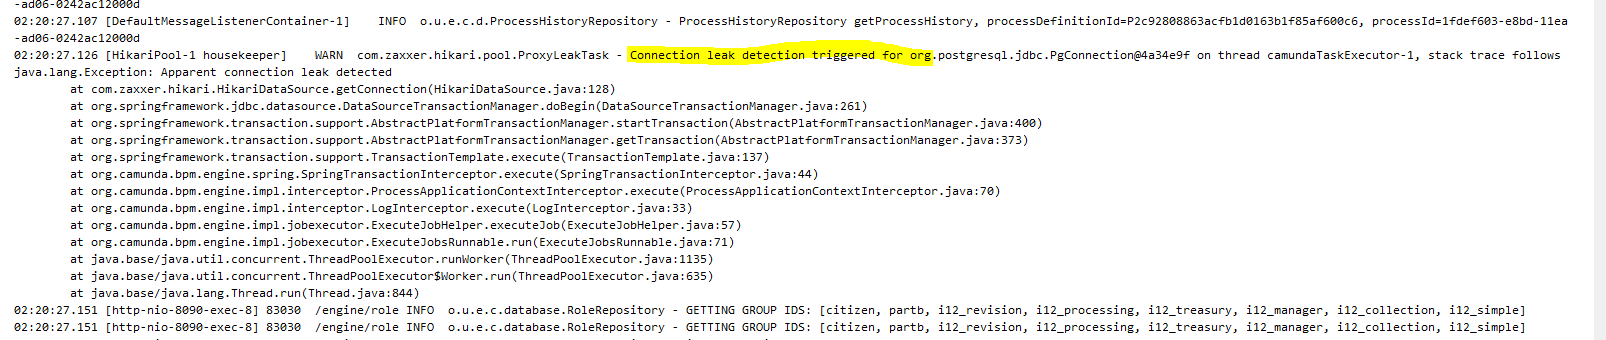
One possible reason:
Server is quite busy and does not have much free memory.
Hikari maximumPoolSize is 30.
@Erki_Kriks which version of HikariCP are you using? Upgrade to latest version of HikariCP.
Try the below settings:
ds.setDriverClassName("");
ds.setJdbcUrl("jdbc:postgresql://localhost:5432/somedb");
ds.setUsername("dbuser");
ds.setPassword("password");
ds.setMinimumIdle(5);
ds.setMaximumPoolSize(30);
ds.setIdleTimeout(600000);
ds.setLeakDetectionThreshold(30000);
ds.setConnectionTimeout(30000);
ds.setValidationTimeout(TimeUnit.MINUTES.toMillis(1));
ds.setMaxLifetime(TimeUnit.MINUTES.toMillis(5));
ds.setConnectionTestQuery("SELECT 1");
HikariCP 3.4.5 (the latest)
My current settings are:
hikari:
connection-init-sql: SELECT 1
connection-test-query: SELECT 1
auto-commit: true
connection-timeout: 30000
idle-timeout: 600000
leak-detection-threshold: 45000
max-lifetime: 1800000
maximum-pool-size: 30
validation-timeout: 5000
Are you accessing the db connection in your application anywhere like this:
dataSource.getConnection();
Enable the below log and check the logs:
logging.level.com.zaxxer.hikari=debug
Also check CPU utilization and available memory of the server. If its been utilized you can think of either horizontal or vertical scaling.