Hello Everybody,
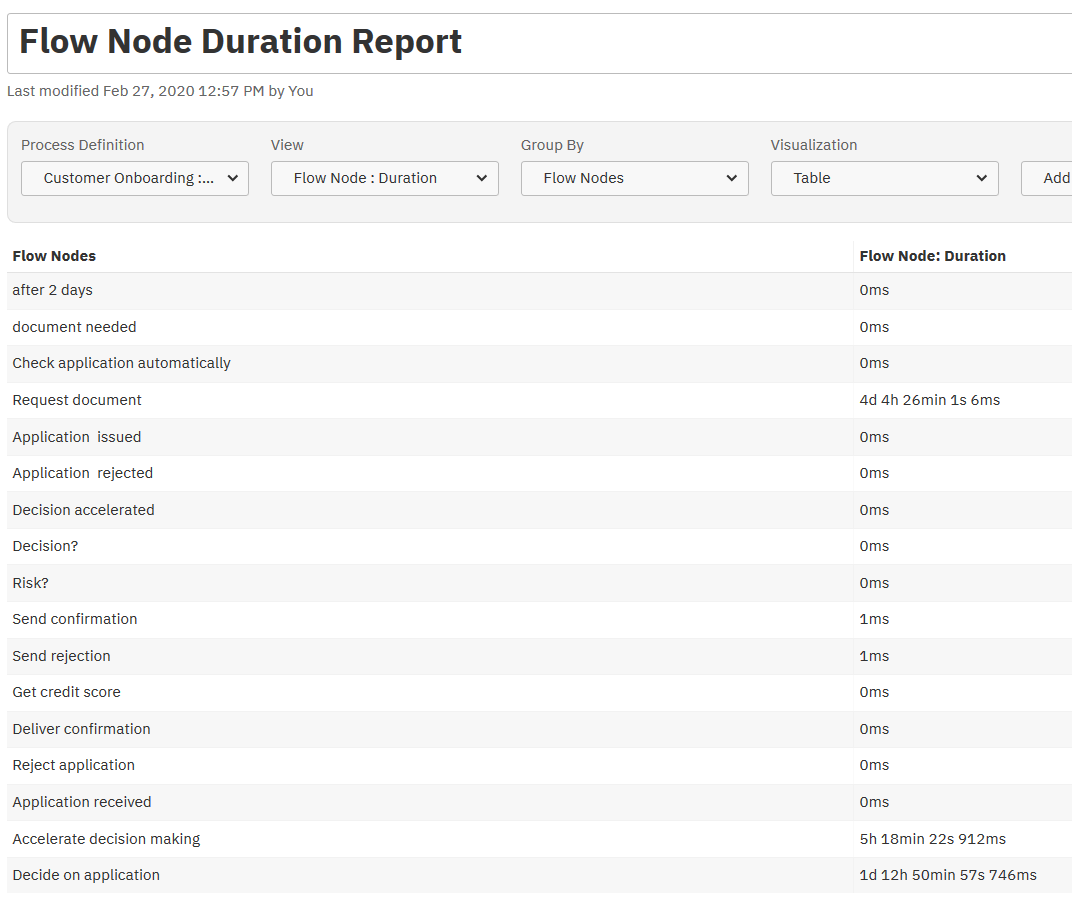
I created a report to show running user and service tasks.
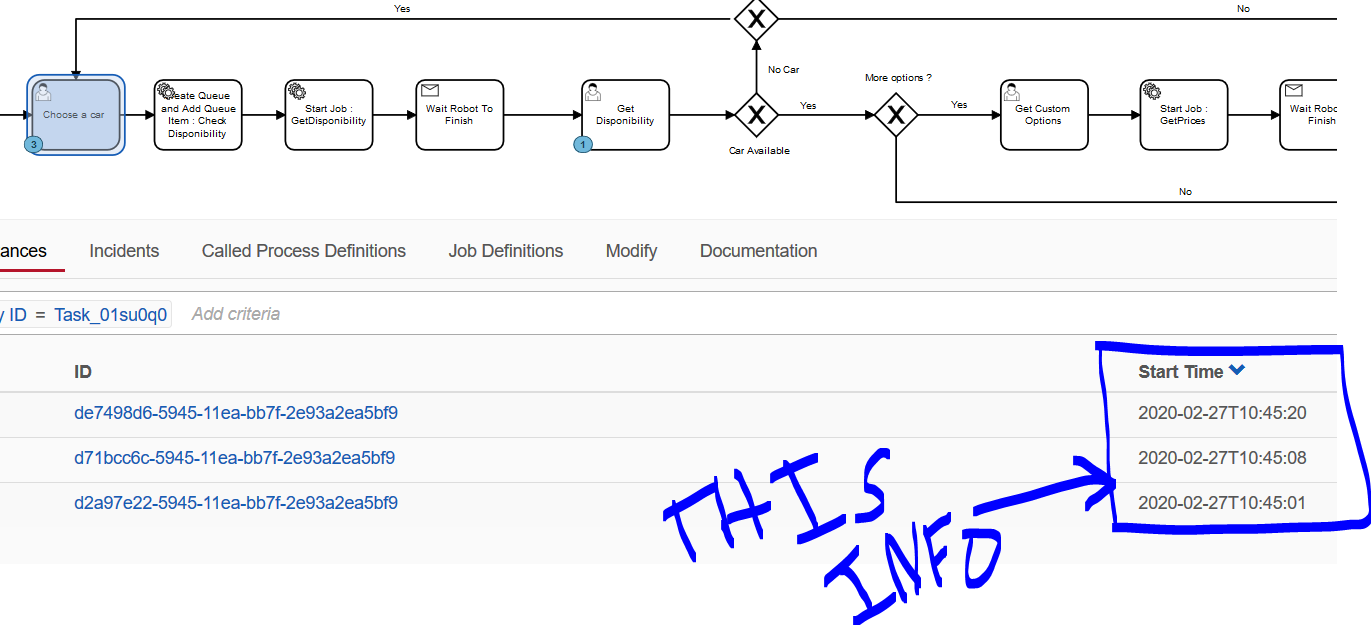
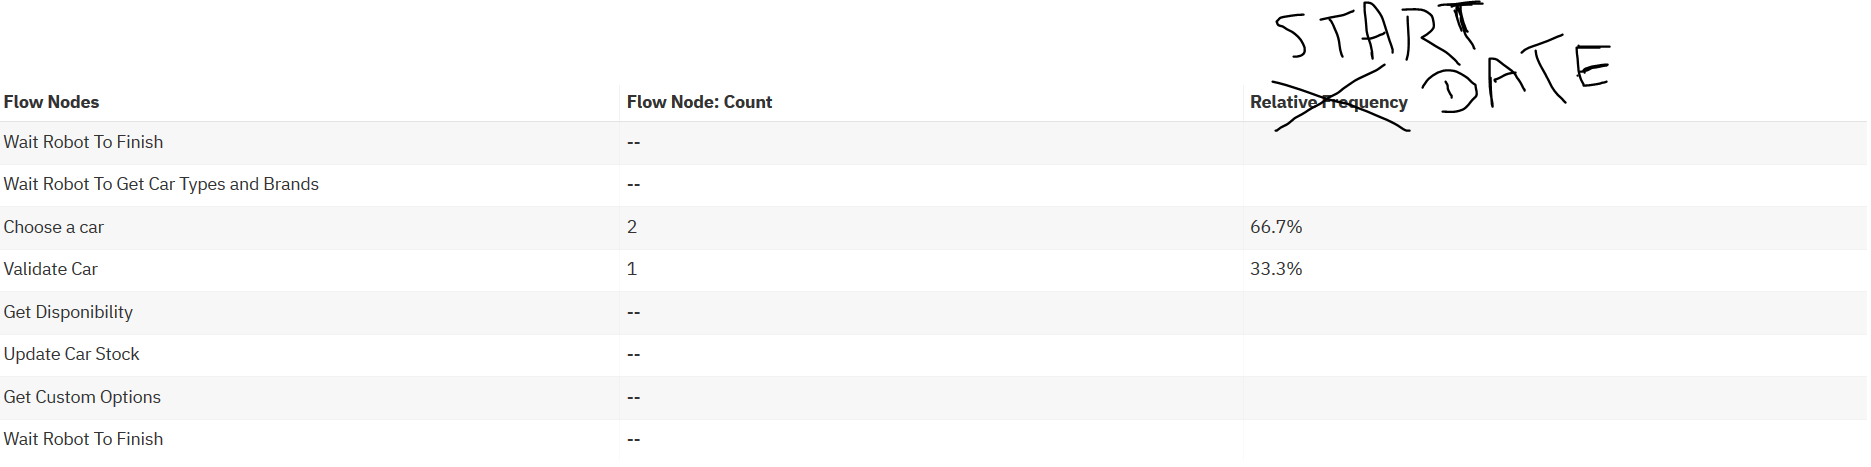
My question : How can i show start_time of this tasks in my dashboard.
this is how i want it :
Thank you.
Hi @Othmen
thank you for the question.
This kind of report is currently not possible in Optimize - however we are planning on offering something similar for User Tasks.
Could you give me maybe some background on use-cases where you see this feature being used?
This will help us a lot 
Best
Felix
Hello felix,
Thank you for your answear.
I’m an RPA developer, so in my workflow i have to start some robot and wait for its responses via the receive task. So i have to know the start date of this task to have a visibility on robot execution.
For example, if i start a robot and i know that it takes 10 maximum to treat and i see in my dashboard that the robot started 30 minutes ago i know directly that there is a problem in robot execution.
Is that clear for you ?
Thank you
Hi @Othmen
this is an interesting use case. Thank you for describing it.
While we do not have it yet I think we can consider it for future versions.
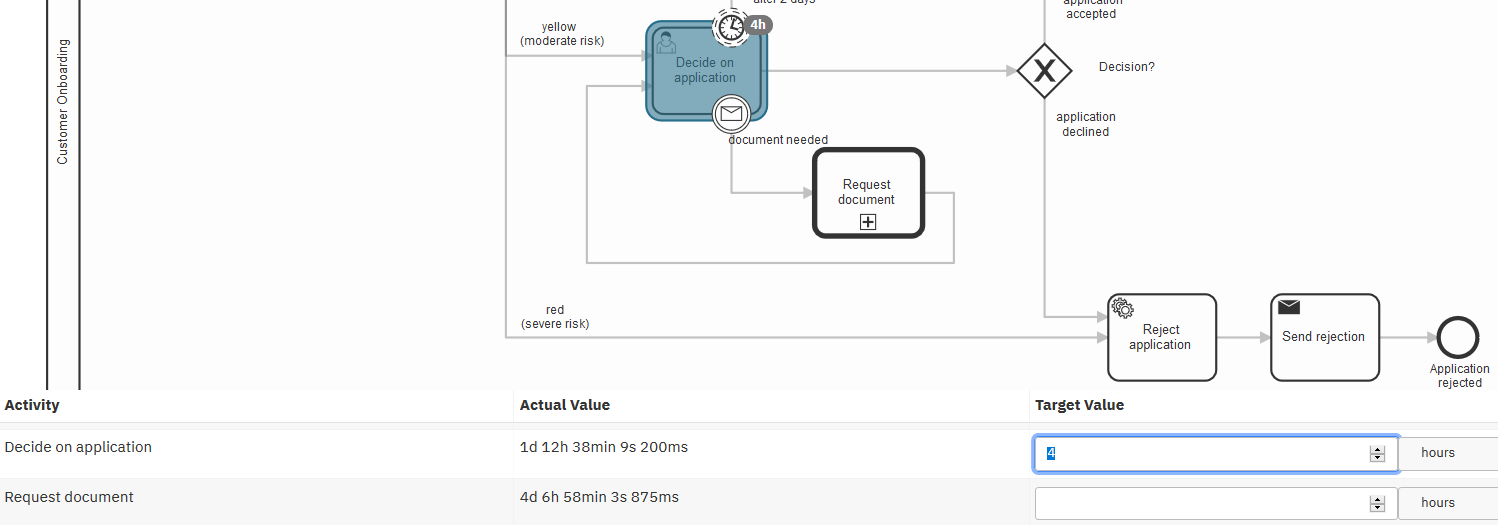
Meanwhile: Would it be useful for you eventually to look at the average duration or maximum duration of the tasks using the View “Flow node->Duration”, Group by “flow node” capabilities?
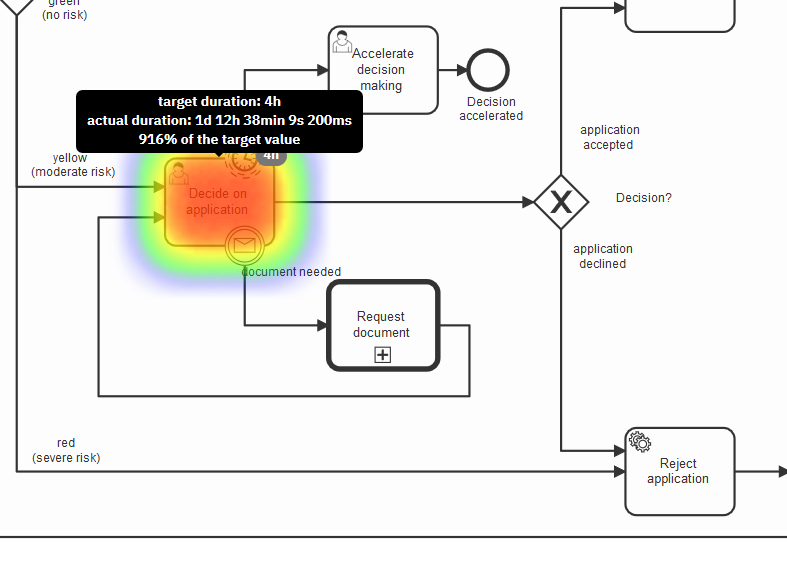
You could visualize it as a Heatmap e.g. to directly see the process too?
Best
Felix
Hello felix,
I don’t want an average, in my case it will be multiple running instances so for the robot task for example, if i have 5 instances waiting for it i want to know when the first instance started to do my calculation and know if there is a problem or not.
Thank you
Hello rob2universe,
Thank you for your answer.
I’m using actually flow node duration but for example if i have 3 instances wainting for the same task, i will see the duration of the three tasks and not one by one.
Thank you
How would the report know which tasks / part of the graph you want to aggregate? Would you want to preselect this during the report definition?
Oh, you want to get rid of the aggregation across multiple executions. Is this possible in your case by adding an additional filter by a variable? Do you carry a unique (business) key per instance, which you could use to filter down to the specific process instance?
Well, Felix already said that the start time is currently not available. However, I understand in fact you want the start time so you can compute the duration and see if it exceeds your threshold for the RPA worker.
If you filter the flow node duration report by additional criteria until it becomes so restrictive that it aggregates only 1 process instances (for instance by filtering by a unique process variable such as “application number”), then it effectively remove the aggregation and you would end up with a report that shows you the duration of the individual task instances.
Yes, i understand but this report is destined to my customers, so they cannot change the filter every time to see individual task instances.
When adding the filter, it demands to choose one instance from the current instances so it’s not dynamic