This has been a question asked many times, and so wanted to document is for others:
The question is often asked: “how can i debug a script?”, “how can i debug a script without doing redeployments, etc”
using an IDE with a debugger (Such as netbeans or IntelliJ) do the following:
-
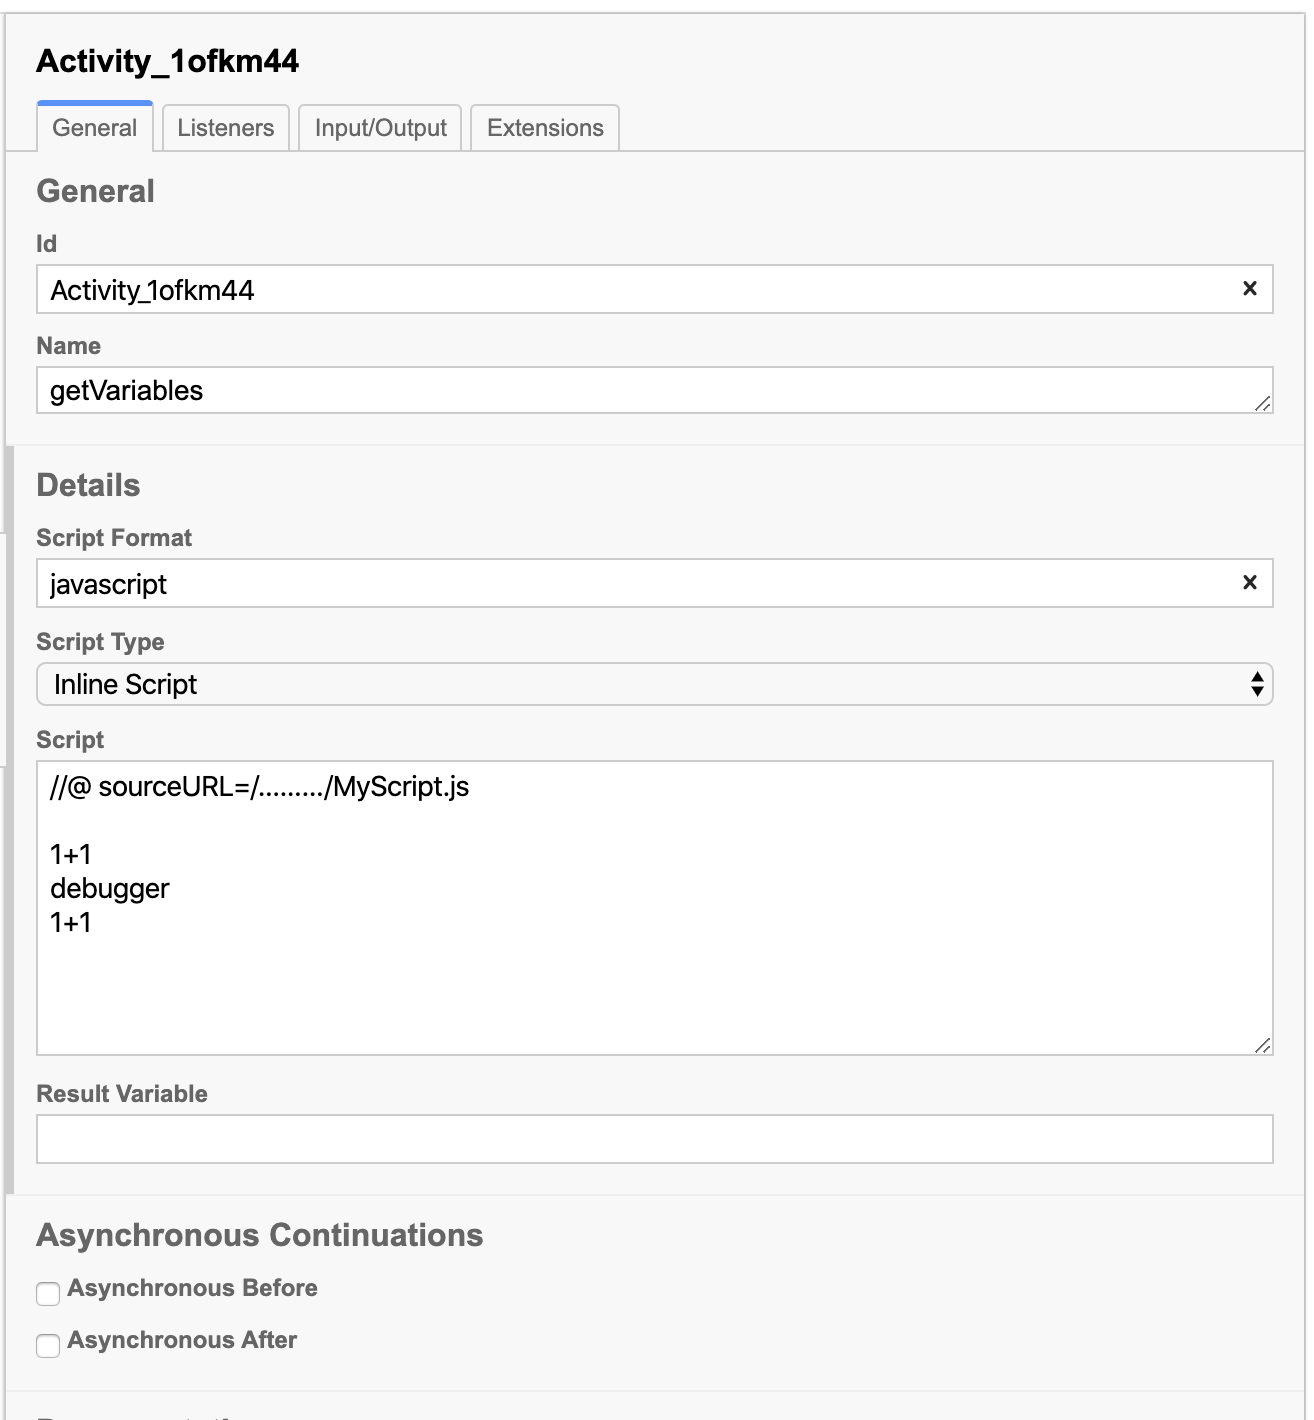
In your script add the following on the first line of the script (including the
//)://@ sourceURL=/absolute/path/to/MyScript.jsThis tells the IDE where to find the source script to show in the debug (because scripts can be passed into the ScriptEngine as a Reader or just a string, and therefore we need a source file to debug against.
-
write your script, and add the a line
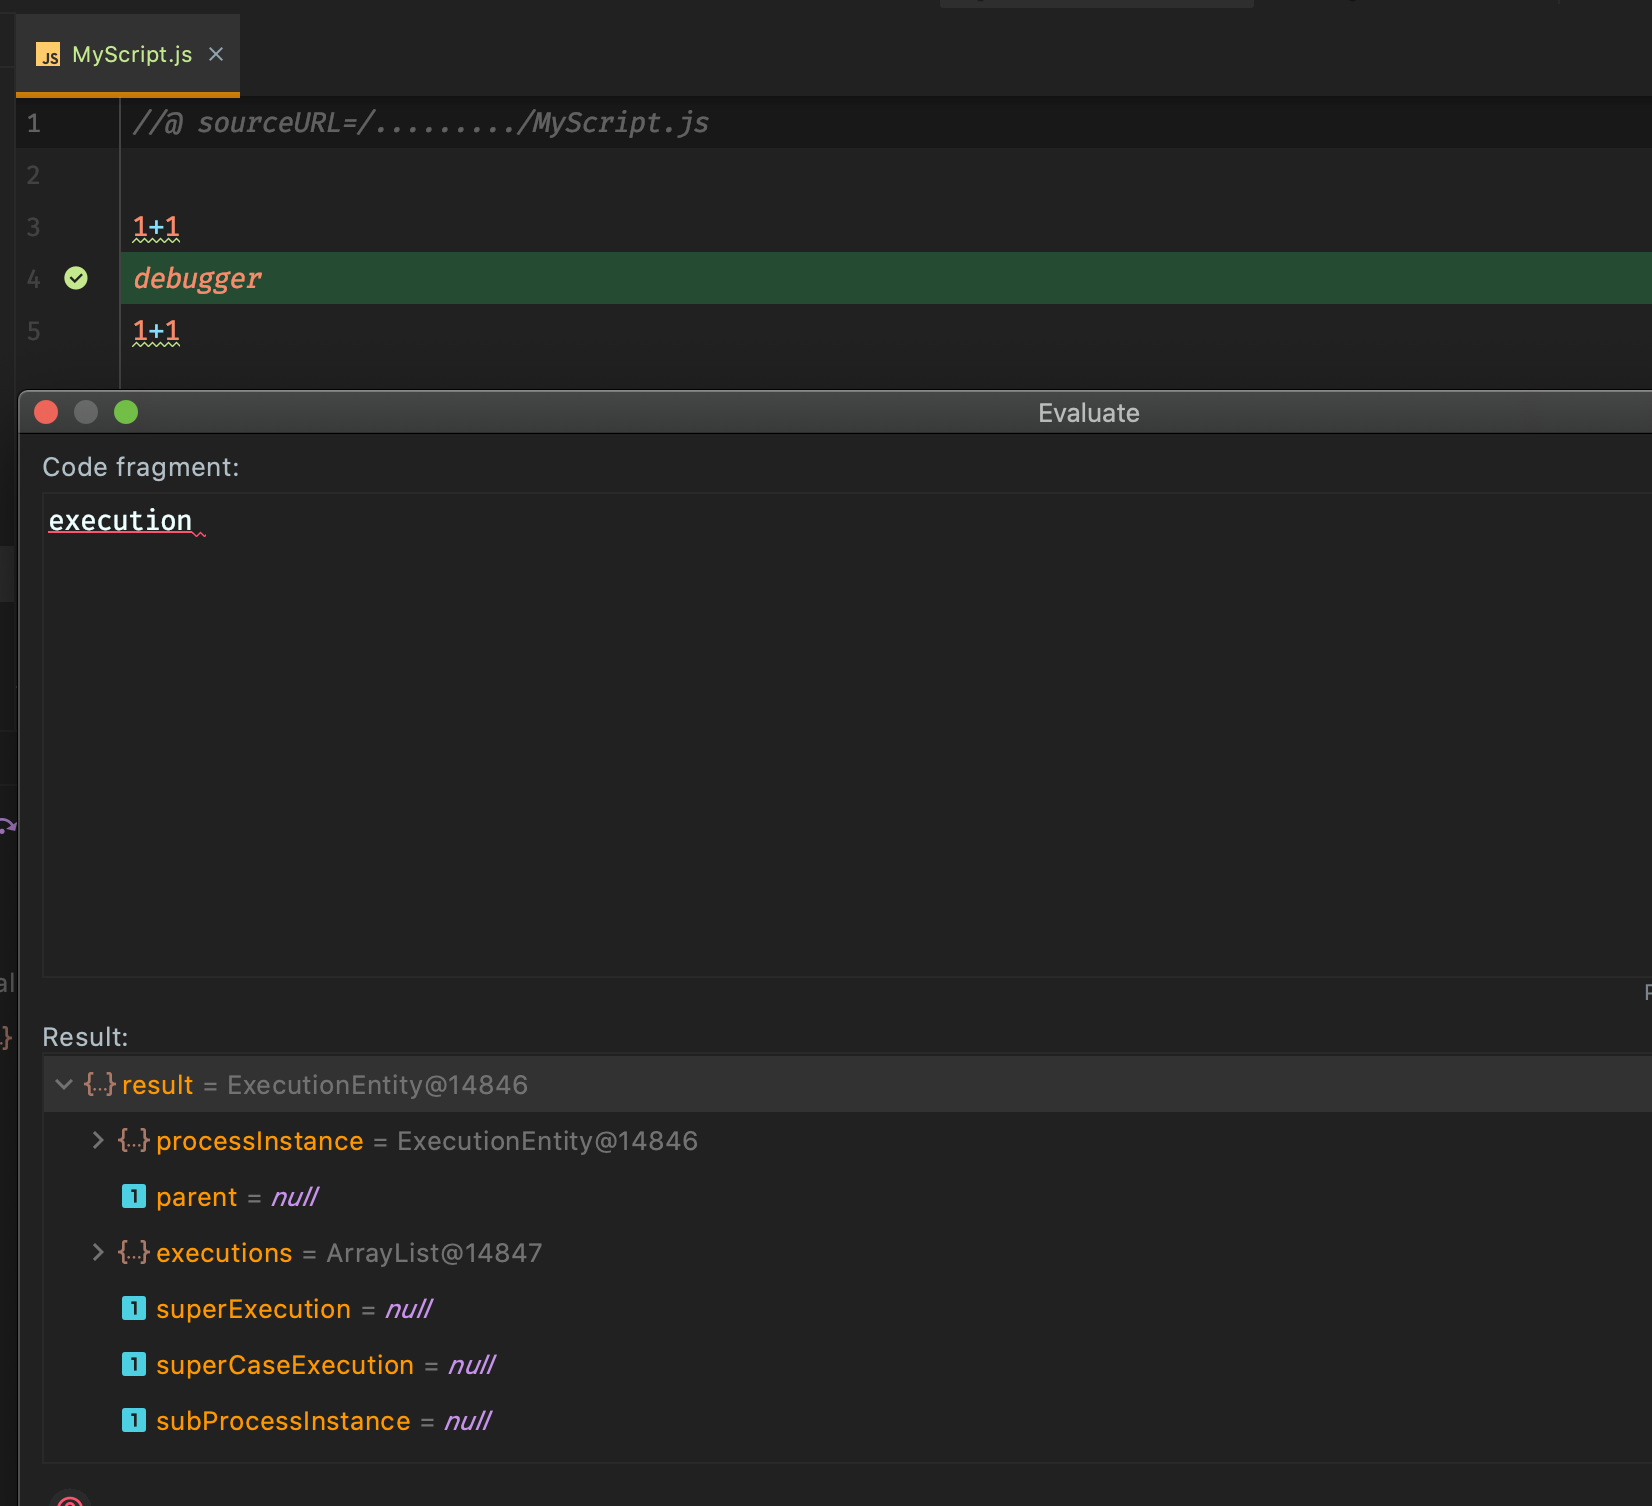
debugger;to wherever you want to execute your debug. Same way as you would do in a browser debug. -
Run Camunda with a JVM debugger attached (Such as commonly named “Debug Application” within Intellij) and deploy your BPMN.
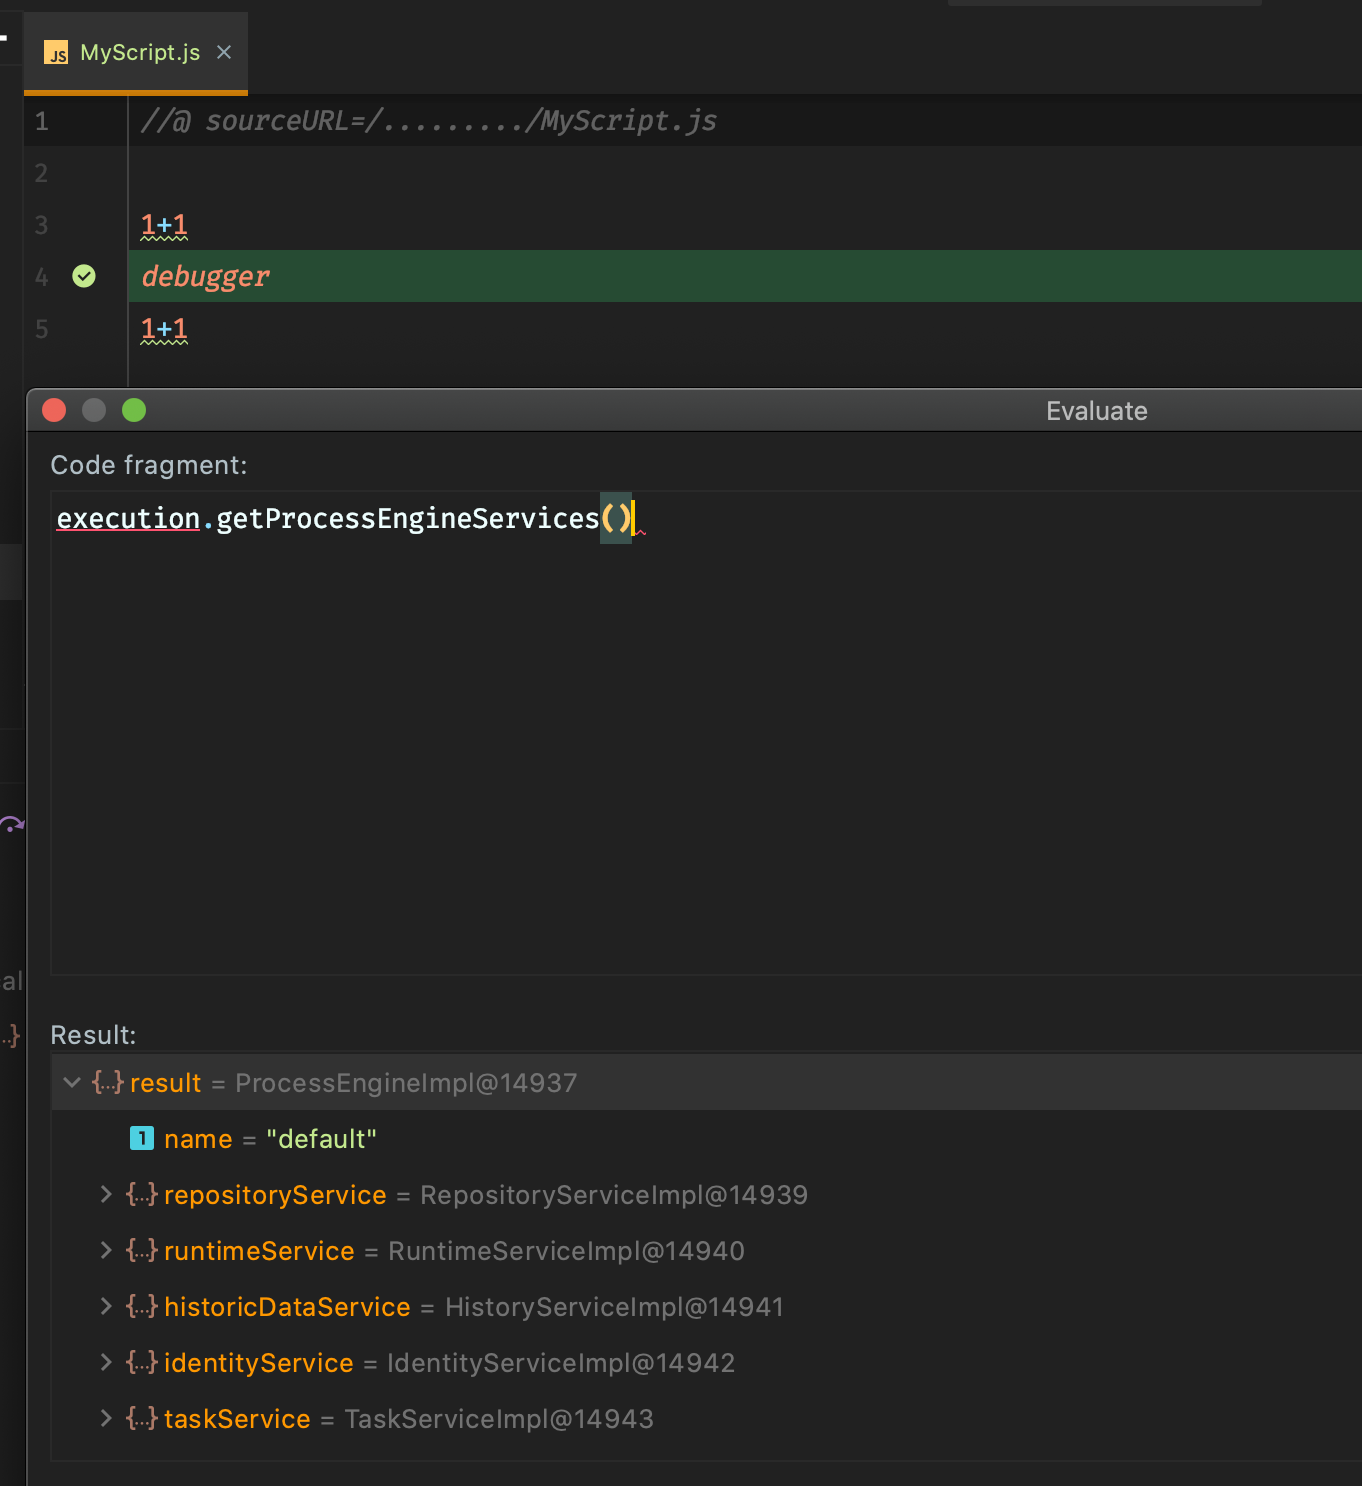
When the eval picks up the debugger line it will route to the file based on the sourceURL line and you will have the regular debugging tools available (including the expression evaluator)
Note: If you misconfigure the sourceURL path, the debugger will not throw any error: It will just continue as if the debugger statement did not exist.