I’m fairly new to Camunda 8 but have successfully set up a process that creates Microsoft Planner Tasks via the Graph API. Everything works well in terms of deployment and connectivity, and we have now moved into a real testing phase with an actual use case.
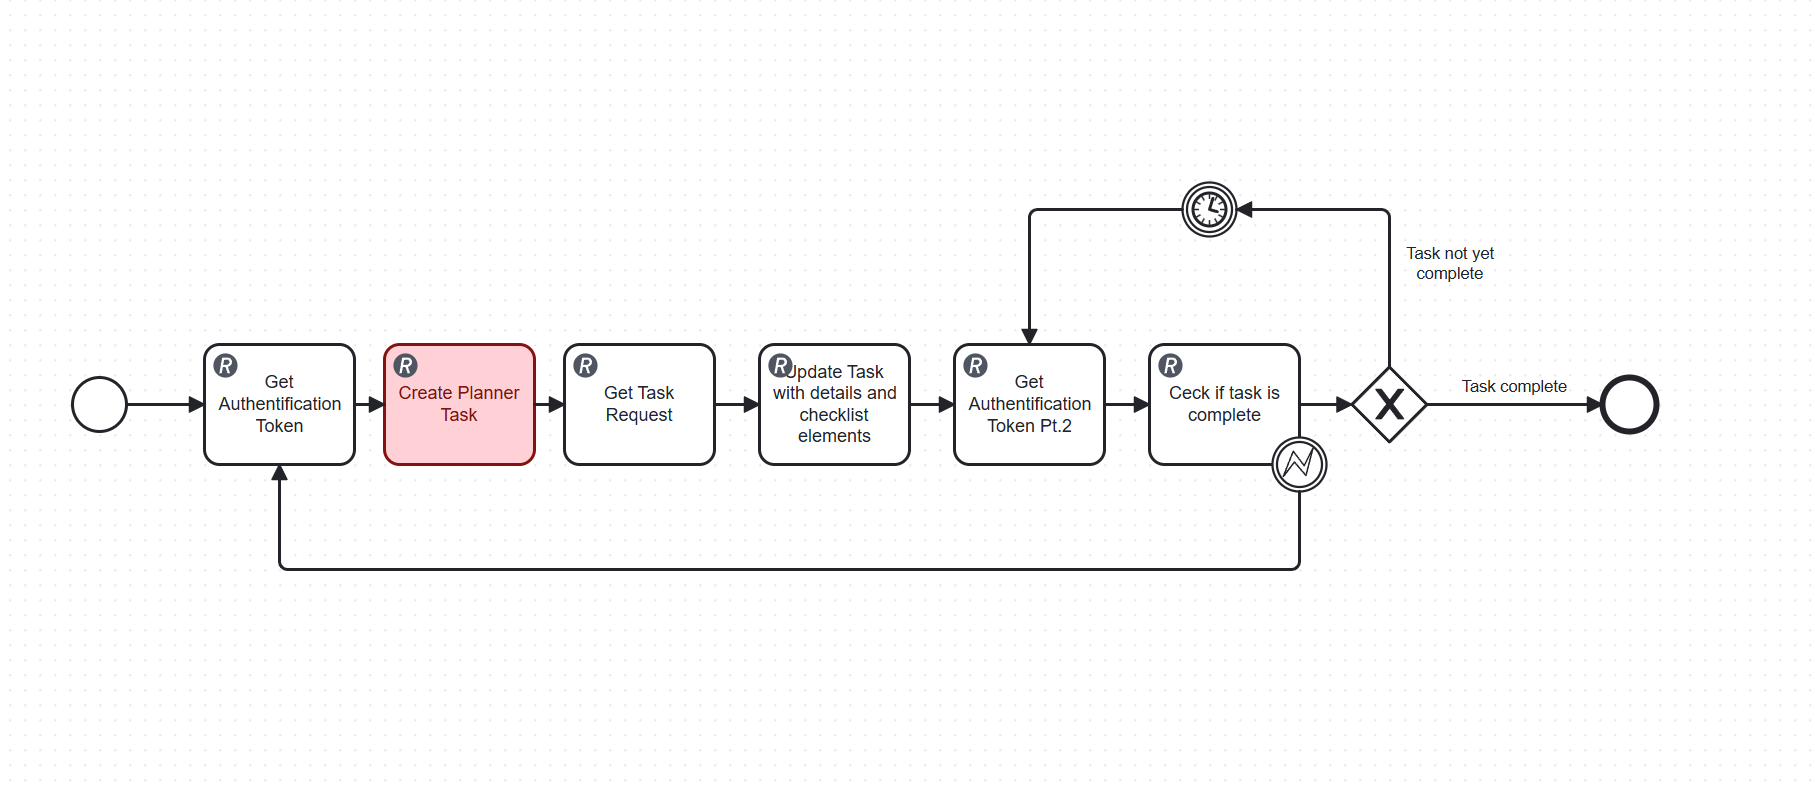
The process flow is as follows:
Create the Planner Task
Update it with details and checklist items
Poll the Graph API in a loop to check whether the task has been marked as complete
The polling loop runs on a short timer interval and overwrites two process variables on every iteration (the auth token and the task status). I’ve noticed that Elasticsearch creates a new index entry for every single variable update, which causes the variable history to grow very rapidly.
With multiple active process instances running in parallel, this leads to thousands of Elasticsearch documents per day, which slows down the entire platform to the point where it becomes unusable.
I already investigated using a webhook from Microsoft Planner to avoid polling altogether, but from what I’ve found, the Microsoft Graph API does not currently support change notifications for Planner tasks.
My questions:
Is there a way to exclude specific variables from being written to the Elasticsearch history?
Are there any recommended patterns in Camunda 8 for waiting on an external system to complete a task, without relying on a polling loop?
Any help or suggestions would be greatly appreciated!
Your polling loop is causing excessive Elasticsearch indexing due to frequent variable updates, which is a common performance issue with this pattern. I found the following relevant resources:
Have you tried checking your configuration settings for this? A few things that commonly cause this type of issue:
Check if there are any recent updates or changes to your setup that might have triggered this behavior.
Look at the logs for any error messages around the time this started happening. The specific error codes will point you to the root cause faster than guessing.
If you are self-hosting, make sure your environment variables and config files are properly set. Sometimes a missed setting after an upgrade causes exactly this kind of problem.
What version are you running, and did this start after a specific change?
Regarding the history cleanup configuration: I disabled Optimize entirely, which reduced the Elasticsearch load partially since Optimize was periodically reading from the Zeebe indices and writing into its own Optimize indices. However, this did not solve the root cause — Zeebe itself is still writing a new Elasticsearch document for every single variable update inside the polling loop. So the excessive indexing is still ongoing.
Regarding the webhook approach: As far as I can tell, Microsoft Planner does not support native webhooks. The Microsoft Graph change notifications API could theoretically work, but it requires a publicly accessible HTTPS endpoint that immediately responds with a 200 OK containing a validation token — essentially a middleware service between Camunda and Planner. This adds significant infrastructure complexity, which is why I have not gone down that route yet.
The message correlation pattern has the same prerequisite — something external needs to trigger the message into Camunda, which again requires that middleware layer.
For now I am considering increasing the polling timer interval significantly (e.g. to 30 minutes) as a short-term fix to reduce the number of Elasticsearch writes, while I investigate whether the Zeebe Exporter variable history can be configured or limited in any way.
Any advice on reducing Zeebe variable indexing specifically would be very appreciated!
This is my first long-term run with this Docker setup. During my earlier test phases I only ran it for a few hours at a time to verify that my custom dashboard was reading data correctly. This time it ran for over a month with a real use case, and that is when the performance issue became apparent.
Unfortunately I can no longer access the logs because I had to run docker compose down and delete the instance entirely. Tasklist and Operate had slowed down to the point where I could not use the UI anymore, so I had to delete all process instances directly via the file system rather than through the interface. After the cleanup everything was fast again, which confirmed my suspicion.
Before shutting everything down I did some research and found that Elasticsearch creates a new index entry for every variable update during runtime. I then checked my process and identified two variables inside a Planner Task polling loop that were being updated continuously — every 10 seconds for the entire duration the process instance was running.
Removing those instances from the history restored normal performance immediately.
I started from a clean official Docker Compose file and only made minor modifications, specifically adding a host variable to allow access via IP address. The setup has never been updated since the initial installation about 3 months ago. Everything runs fine when process instances are short-lived.
To answer your question: I am running Camunda 8.8.9. The issue did not appear during short test phases, only after running a process instance continuously for over a month with a high-frequency polling loop writing to Elasticsearch on every iteration.
As a short-term fix I am now increasing the polling interval significantly (e.g. to 30 minutes) to reduce the number of variable updates and therefore the number of Elasticsearch index entries created during runtime.
Do you happen to know if there is a way to configure or limit how Zeebe indexes variable updates into Elasticsearch during runtime? Ideally I would like to either reduce the history written for specific variables, or prevent old variable versions from being indexed at all. Any pointers would be greatly appreciated!