Hello! I have test stand.
Java app with
"io.camunda:spring-zeebe-starter:8.1.12"
"io.camunda:zeebe-client-java:8.1.5"
Docker containers
camunda/zeebe:8.1.5
elasticsearch:7.17.0
And it works very good! But some time later only one job type can’t start handler
Java client log:
io.grpc.StatusRuntimeException: DEADLINE_EXCEEDED: Time out between gateway and broker: Request ProtocolRequest{id=32953, subject=command-api-1, sender=0.0.0.0:26502, payload=byte[]{length=1157, hash=-1568037875}} to 0.0.0.0:26501 timed out in PT10S
	at io.grpc.Status.asRuntimeException(Status.java:535) ~[grpc-api-1.49.1.jar!/:1.49.1]
	at io.grpc.stub.ClientCalls$StreamObserverToCallListenerAdapter.onClose(ClientCalls.java:487) ~[grpc-stub-1.49.1.jar!/:1.49.1]
	at io.grpc.internal.ClientCallImpl.closeObserver(ClientCallImpl.java:563) ~[grpc-core-1.49.1.jar!/:1.49.1]
	at io.grpc.internal.ClientCallImpl.access$300(ClientCallImpl.java:70) ~[grpc-core-1.49.1.jar!/:1.49.1]
	at io.grpc.internal.ClientCallImpl$ClientStreamListenerImpl$1StreamClosed.runInternal(ClientCallImpl.java:744) ~[grpc-core-1.49.1.jar!/:1.49.1]
	at io.grpc.internal.ClientCallImpl$ClientStreamListenerImpl$1StreamClosed.runInContext(ClientCallImpl.java:723) ~[grpc-core-1.49.1.jar!/:1.49.1]
	at io.grpc.internal.ContextRunnable.run(ContextRunnable.java:37) ~[grpc-core-1.49.1.jar!/:1.49.1]
	at io.grpc.internal.SerializingExecutor.run(SerializingExecutor.java:133) ~[grpc-core-1.49.1.jar!/:1.49.1]
	at java.base/java.util.concurrent.ThreadPoolExecutor.runWorker(ThreadPoolExecutor.java:1136) ~[na:na]
	at java.base/java.util.concurrent.ThreadPoolExecutor$Worker.run(ThreadPoolExecutor.java:635) ~[na:na]
	at java.base/java.lang.Thread.run(Thread.java:833) ~[na:na]
camunda/zeebe output log:
2022-12-21 12:26:17.028 [ActivateJobsHandler] [Broker-0-zb-actors-1] DEBUG
io.camunda.zeebe.gateway - Failed to send 2 activated jobs for type admin-module-get-custom-message-task-z (with job keys: [2251799930062329, 2251799930062332]) to client, because: Failed to send activated jobs to client
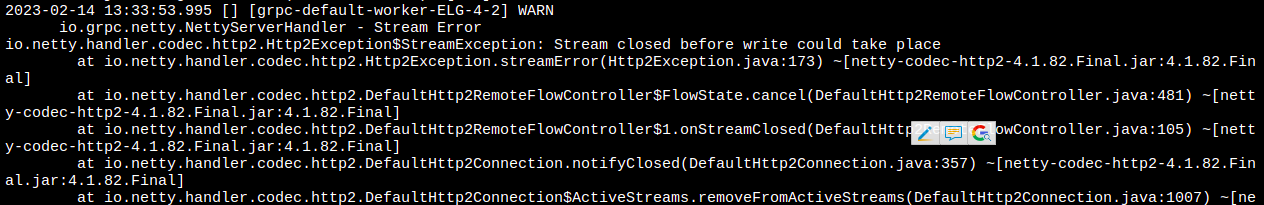
2022-12-21 12:26:22.160 [] [grpc-default-worker-ELG-5-1] WARN
io.grpc.netty.NettyServerHandler - Stream Error
io.netty.handler.codec.http2.Http2Exception$StreamException: Stream closed before write could take place
at io.netty.handler.codec.http2.Http2Exception.streamError(Http2Exception.java:173) ~[netty-codec-http2-4.1.82.Final.jar:4.1.82.Final]
at io.netty.handler.codec.http2.DefaultHttp2RemoteFlowController$FlowState.cancel(DefaultHttp2RemoteFlowController.java:481) ~[netty-codec-http2-4.1.82.Final.jar:4.1.82.Final]
at io.netty.handler.codec.http2.DefaultHttp2RemoteFlowController$1.onStreamClosed(DefaultHttp2RemoteFlowController.java:105) ~[netty-codec-http2-4.1.82.Final.jar:4.1.82.Final]
at io.netty.handler.codec.http2.DefaultHttp2Connection.notifyClosed(DefaultHttp2Connection.java:357) ~[netty-codec-http2-4.1.82.Final.jar:4.1.82.Final]
at io.netty.handler.codec.http2.DefaultHttp2Connection$ActiveStreams.removeFromActiveStreams(DefaultHttp2Connection.java:1007) ~[netty-codec-http2-4.1.82.Final.jar:4.1.82.Final]
at io.netty.handler.codec.http2.DefaultHttp2Connection$ActiveStreams.deactivate(DefaultHttp2Connection.java:963) ~[netty-codec-http2-4.1.82.Final.jar:4.1.82.Final]
at io.netty.handler.codec.http2.DefaultHttp2Connection$DefaultStream.close(DefaultHttp2Connection.java:515) ~[netty-codec-http2-4.1.82.Final.jar:4.1.82.Final]
at io.netty.handler.codec.http2.DefaultHttp2Connection$DefaultStream.close(DefaultHttp2Connection.java:521) ~[netty-codec-http2-4.1.82.Final.jar:4.1.82.Final]
at io.netty.handler.codec.http2.Http2ConnectionHandler.closeStream(Http2ConnectionHandler.java:628) ~[netty-codec-http2-4.1.82.Final.jar:4.1.82.Final]
at io.netty.handler.codec.http2.DefaultHttp2ConnectionDecoder$FrameReadListener.onRstStreamRead(DefaultHttp2ConnectionDecoder.java:444) ~[netty-codec-http2-4.1.82.Final.jar:4.1.82.Final]
at io.netty.handler.codec.http2.Http2InboundFrameLogger$1.onRstStreamRead(Http2InboundFrameLogger.java:80) ~[netty-codec-http2-4.1.82.Final.jar:4.1.82.Final]
at io.netty.handler.codec.http2.DefaultHttp2FrameReader.readRstStreamFrame(DefaultHttp2FrameReader.java:509) ~[netty-codec-http2-4.1.82.Final.jar:4.1.82.Final]
at io.netty.handler.codec.http2.DefaultHttp2FrameReader.processPayloadState(DefaultHttp2FrameReader.java:259) ~[netty-codec-http2-4.1.82.Final.jar:4.1.82.Final]
at io.netty.handler.codec.http2.DefaultHttp2FrameReader.readFrame(DefaultHttp2FrameReader.java:159) ~[netty-codec-http2-4.1.82.Final.jar:4.1.82.Final]
at io.netty.handler.codec.http2.Http2InboundFrameLogger.readFrame(Http2InboundFrameLogger.java:41) ~[netty-codec-http2-4.1.82.Final.jar:4.1.82.Final]
at io.netty.handler.codec.http2.DefaultHttp2ConnectionDecoder.decodeFrame(DefaultHttp2ConnectionDecoder.java:173) ~[netty-codec-http2-4.1.82.Final.jar:4.1.82.Final]
at io.netty.handler.codec.http2.Http2ConnectionHandler$FrameDecoder.decode(Http2ConnectionHandler.java:393) ~[netty-codec-http2-4.1.82.Final.jar:4.1.82.Final]
at io.netty.handler.codec.http2.Http2ConnectionHandler.decode(Http2ConnectionHandler.java:453) ~[netty-codec-http2-4.1.82.Final.jar:4.1.82.Final]
at io.netty.handler.codec.ByteToMessageDecoder.decodeRemovalReentryProtection(ByteToMessageDecoder.java:519) ~[netty-codec-4.1.82.Final.jar:4.1.82.Final]
at io.netty.handler.codec.ByteToMessageDecoder.callDecode(ByteToMessageDecoder.java:458) ~[netty-codec-4.1.82.Final.jar:4.1.82.Final]
at io.netty.handler.codec.ByteToMessageDecoder.channelRead(ByteToMessageDecoder.java:280) ~[netty-codec-4.1.82.Final.jar:4.1.82.Final]
at io.netty.channel.AbstractChannelHandlerContext.invokeChannelRead(AbstractChannelHandlerContext.java:379) ~[netty-transport-4.1.82.Final.jar:4.1.82.Final]
Also I started getting periodic background log
Java client background log:
2022-12-21 12:23:28.964  INFO 7 --- [-worker-ELG-1-2] io.grpc.internal.AbstractClientStream    : Received data on closed stream
2022-12-21 12:23:28.964  INFO 7 --- [-worker-ELG-1-2] io.grpc.internal.AbstractClientStream    : Received data on closed stream
2022-12-21 12:23:28.964  INFO 7 --- [-worker-ELG-1-2] io.grpc.internal.AbstractClientStream    : Received data on closed stream
2022-12-21 12:23:28.964  INFO 7 --- [-worker-ELG-1-2] io.grpc.internal.AbstractClientStream    : Received data on closed stream
2022-12-21 12:23:28.964  INFO 7 --- [-worker-ELG-1-2] io.grpc.internal.AbstractClientStream    : Received data on closed stream
2022-12-21 12:23:28.964  INFO 7 --- [-worker-ELG-1-2] io.grpc.internal.AbstractClientStream    : Received data on closed stream
2022-12-21 12:23:28.964  INFO 7 --- [-worker-ELG-1-2] io.grpc.internal.AbstractClientStream    : Received data on closed stream
2022-12-21 12:23:28.964  INFO 7 --- [-worker-ELG-1-2] io.grpc.internal.AbstractClientStream    : Received data on closed stream
2022-12-21 12:23:28.964  INFO 7 --- [-worker-ELG-1-2] io.grpc.internal.AbstractClientStream    : Received data on closed stream
2022-12-21 12:23:28.964  INFO 7 --- [-worker-ELG-1-2] io.grpc.internal.AbstractClientStream    : Received data on closed stream
2022-12-21 12:23:28.964  INFO 7 --- [-worker-ELG-1-2] io.grpc.internal.AbstractClientStream    : Received data on closed stream
2022-12-21 12:23:28.964  INFO 7 --- [-worker-ELG-1-2] io.grpc.internal.AbstractClientStream    : Received data on closed stream
This fail is actual only for one job type.
Others jobs work correctly.
Also this job works correctly when camunda/zeebe and elasticsearch starts without old data.
How can I get more info about why job can’t start?
Thank you!