I am facing an grpc stream write error on the gateway pod when running the benchmkaring tool against camunda k8s setup. My helm values configuration file is shared below.
The interesting fact is that the error disappears on deleting the volumes of the k8s cluster through kubectl delete pvc --all command. I have a couple of questions
What is the correlation of the stream write error seen in the gateway logs with persistent volumes i.e. zeebe broker data ?
Why do the volumes not get deleted on helm uninstall command?
We have observed that any change in the helm values configuration file requires us to delete all the persistent volumes before we start the benchmarking again. Could you please explain the technical reason behind this?
Thanks
Helm values.yaml file
global:
identity:
auth:
# Disable the Identity authentication for local development
# it will fall back to basic-auth: demo/demo as default user
enabled: false
elasticsearch:
disableExporter: true
# Disable identity as part of the camunda platform core
identity:
enabled: false
optimize:
enabled: false
# Configure tasklist to make it off for local development
tasklist:
enabled: false
# Configure operate to make it off for local development
operate:
enabled: false
elasticsearch:
enabled: false
zeebe:
clusterSize: 3
partitionCount: 3
replicationFactor: 2
cpuThreadCount: 4
ioThreadCount: 4
env:
- name: ZEEBE_BROKER_EXECUTION_METRICS_EXPORTER_ENABLED
value: "true"
pvcSize: 128Gi
resources:
requests:
cpu: 2
memory: 4Gi
limits:
cpu: 2
memory: 4Gi
zeebe-gateway:
replicas: 1
env:
- name: ZEEBE_GATEWAY_THREADS_MANAGEMENTTHREADS
value: "4"
- name: ZEEBE_GATEWAY_MONITORING_ENABLED
value: "true"
resources:
requests:
cpu: 1
memory: 512Mi
limits:
cpu: 1
memory: 512Mi
# PrometheusServiceMonitor configuration for the prometheus service monitor
prometheusServiceMonitor:
# PrometheusServiceMonitor.enabled if true then a service monitor will be deployed, which allows a installed prometheus controller to scrape metrics from the broker pods
enabled: false
P.S - There is a github issue with the same stacktrace but in a different scenario (high payload) reported too.
On further troubleshooting we found an interesting fact. We get the below warning on the zeebe-gateway on certain aws cluster configuration when running the benchmarking tool.
3 brokers, 3 partitions - No error
4 brokers, 4 partitions - No error
5 brokers, 5 partitions - Stream Error
6 brokers, 12 partitions - Stream Error
7 brokers, 11 partitions - Stream Error
Each broker is configured with 3.5 vcpus, 4.5 GB ram and 2 as the replication factor.
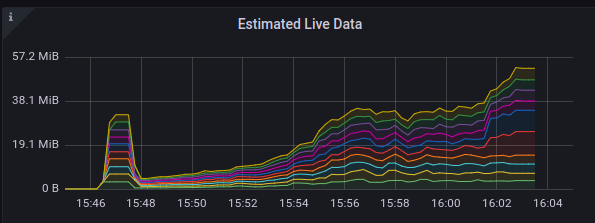
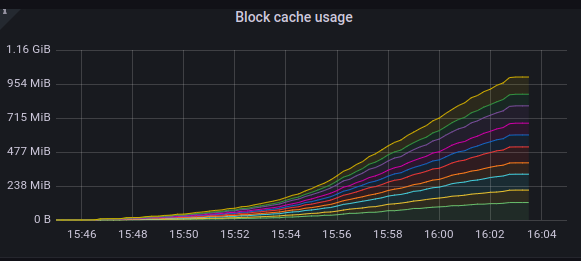
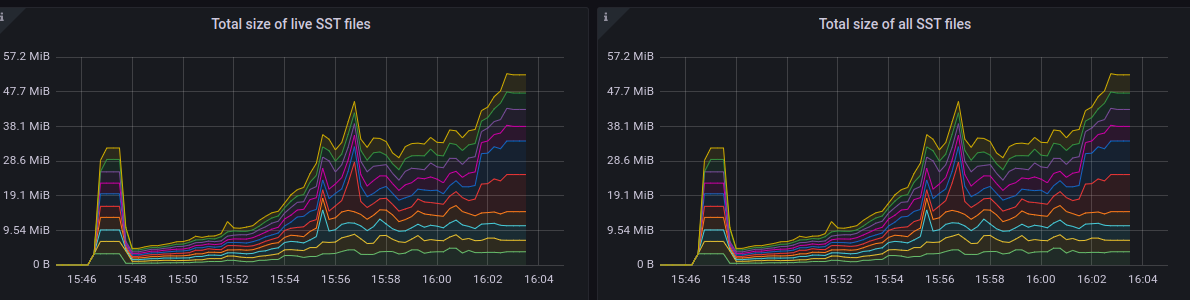
When this error is seen, we have observed a spike in the rocksdb live data, block usage and total SST file. Below are some of the grafana screenshots.
Kindly share some insights on what could be causing the zeebe connection to be closed.
WARN
io.grpc.netty.NettyServerHandler - Stream Error
io.netty.handler.codec.http2.Http2Exception$StreamException: Stream closed before write could take place
Benchmarking tool info message
This corresponding info message is logged on the client i.e. the benchmarking tool.
What is the correlation of the stream write error seen in the gateway logs with persistent volumes i.e. zeebe broker data ?
Not sure whether this is really related the stream error is very generic, and can have multiple causes. Client connection cancelations,interruptions and other things.
Why do the volumes not get deleted on helm uninstall command?
We have observed that any change in the helm values configuration file requires us to delete all the persistent volumes before we start the benchmarking again. Could you please explain the technical reason behind this?
I think I asked you already some time ago why you use replication factor 2? We recommend using an odd number, 1, 3, 5 etc. Due to the RAFT consensus protocol, we use an even count doesn’t really make sense. See related post of mine Zeebe startup issue - #4 by Zelldon
Regarding your observation
3 brokers, 3 partitions - No error
4 brokers, 4 partitions - No error
5 brokers, 5 partitions - Stream Error
6 brokers, 12 partitions - Stream Error
7 brokers, 11 partitions - Stream Error
Do you change the configurations without deleting the PVC’s? Do you see any errors in the broker logs? Are there any exceptions in the gateway log you haven’t posted? Do you restarted the clients? Please post the complete stacktrace, to determine what is going on.
Thanks for the response. Answers to some questions below
We recommend using an odd number, 1, 3, 5 etc
Ok, will try with odd numbers.
Do you change the configurations without deleting the PVC’s?
No we always delete all pvc’s and then change the configuration
Do you see any errors in the broker logs?
No error in the broker logs. We saw warning in the gateway log and info message in the client (benchmarking tool)
Are there any exceptions in the gateway log you haven’t posted?
No exception. A warning message is logged. The stacktrace of it is exactly what is posted on the github issue that I referred in my original post. I will paste the trace again here (at the end) for quick reference
Do you restarted the clients?
Yes, both zeebe engine and the clients are restarted before very tests.
Gateway warning stacktrace
io.netty.handler.codec.http2.Http2Exception$StreamException: Stream closed before write could take place
	at io.netty.handler.codec.http2.Http2Exception.streamError(Http2Exception.java:172) ~[netty-codec-http2-4.1.73.Final.jar:4.1.73.Final]
	at io.netty.handler.codec.http2.DefaultHttp2RemoteFlowController$FlowState.cancel(DefaultHttp2RemoteFlowController.java:481) [netty-codec-http2-4.1.73.Final.jar:4.1.73.Final]
	at io.netty.handler.codec.http2.DefaultHttp2RemoteFlowController$1.onStreamClosed(DefaultHttp2RemoteFlowController.java:105) [netty-codec-http2-4.1.73.Final.jar:4.1.73.Final]
	at io.netty.handler.codec.http2.DefaultHttp2Connection.notifyClosed(DefaultHttp2Connection.java:357) [netty-codec-http2-4.1.73.Final.jar:4.1.73.Final]
	at io.netty.handler.codec.http2.DefaultHttp2Connection$ActiveStreams.removeFromActiveStreams(DefaultHttp2Connection.java:1007) [netty-codec-http2-4.1.73.Final.jar:4.1.73.Final]
	at io.netty.handler.codec.http2.DefaultHttp2Connection$ActiveStreams.deactivate(DefaultHttp2Connection.java:963) [netty-codec-http2-4.1.73.Final.jar:4.1.73.Final]
	at io.netty.handler.codec.http2.DefaultHttp2Connection$DefaultStream.close(DefaultHttp2Connection.java:515) [netty-codec-http2-4.1.73.Final.jar:4.1.73.Final]
	at io.netty.handler.codec.http2.DefaultHttp2Connection$DefaultStream.close(DefaultHttp2Connection.java:521) [netty-codec-http2-4.1.73.Final.jar:4.1.73.Final]
	at io.netty.handler.codec.http2.Http2ConnectionHandler.closeStream(Http2ConnectionHandler.java:613) [netty-codec-http2-4.1.73.Final.jar:4.1.73.Final]
	at io.netty.handler.codec.http2.DefaultHttp2ConnectionDecoder$FrameReadListener.onRstStreamRead(DefaultHttp2ConnectionDecoder.java:444) [netty-codec-http2-4.1.73.Final.jar:4.1.73.Final]
	at io.netty.handler.codec.http2.Http2InboundFrameLogger$1.onRstStreamRead(Http2InboundFrameLogger.java:80) [netty-codec-http2-4.1.73.Final.jar:4.1.73.Final]
	at io.netty.handler.codec.http2.DefaultHttp2FrameReader.readRstStreamFrame(DefaultHttp2FrameReader.java:509) [netty-codec-http2-4.1.73.Final.jar:4.1.73.Final]
	at io.netty.handler.codec.http2.DefaultHttp2FrameReader.processPayloadState(DefaultHttp2FrameReader.java:259) [netty-codec-http2-4.1.73.Final.jar:4.1.73.Final]
	at io.netty.handler.codec.http2.DefaultHttp2FrameReader.readFrame(DefaultHttp2FrameReader.java:159) [netty-codec-http2-4.1.73.Final.jar:4.1.73.Final]
	at io.netty.handler.codec.http2.Http2InboundFrameLogger.readFrame(Http2InboundFrameLogger.java:41) [netty-codec-http2-4.1.73.Final.jar:4.1.73.Final]
	at io.netty.handler.codec.http2.DefaultHttp2ConnectionDecoder.decodeFrame(DefaultHttp2ConnectionDecoder.java:173) [netty-codec-http2-4.1.73.Final.jar:4.1.73.Final]
	at io.netty.handler.codec.http2.Http2ConnectionHandler$FrameDecoder.decode(Http2ConnectionHandler.java:378) [netty-codec-http2-4.1.73.Final.jar:4.1.73.Final]
	at io.netty.handler.codec.http2.Http2ConnectionHandler.decode(Http2ConnectionHandler.java:438) [netty-codec-http2-4.1.73.Final.jar:4.1.73.Final]
	at io.netty.handler.codec.ByteToMessageDecoder.decodeRemovalReentryProtection(ByteToMessageDecoder.java:510) [netty-codec-4.1.73.Final.jar:4.1.73.Final]
	at io.netty.handler.codec.ByteToMessageDecoder.callDecode(ByteToMessageDecoder.java:449) [netty-codec-4.1.73.Final.jar:4.1.73.Final]
	at io.netty.handler.codec.ByteToMessageDecoder.channelRead(ByteToMessageDecoder.java:279) [netty-codec-4.1.73.Final.jar:4.1.73.Final]
	at io.netty.channel.AbstractChannelHandlerContext.invokeChannelRead(AbstractChannelHandlerContext.java:379) [netty-transport-4.1.73.Final.jar:4.1.73.Final]
	at io.netty.channel.AbstractChannelHandlerContext.invokeChannelRead(AbstractChannelHandlerContext.java:365) [netty-transport-4.1.73.Final.jar:4.1.73.Final]
	at io.netty.channel.AbstractChannelHandlerContext.fireChannelRead(AbstractChannelHandlerContext.java:357) [netty-transport-4.1.73.Final.jar:4.1.73.Final]
	at io.netty.channel.DefaultChannelPipeline$HeadContext.channelRead(DefaultChannelPipeline.java:1410) [netty-transport-4.1.73.Final.jar:4.1.73.Final]
	at io.netty.channel.AbstractChannelHandlerContext.invokeChannelRead(AbstractChannelHandlerContext.java:379) [netty-transport-4.1.73.Final.jar:4.1.73.Final]
	at io.netty.channel.AbstractChannelHandlerContext.invokeChannelRead(AbstractChannelHandlerContext.java:365) [netty-transport-4.1.73.Final.jar:4.1.73.Final]
	at io.netty.channel.DefaultChannelPipeline.fireChannelRead(DefaultChannelPipeline.java:919) [netty-transport-4.1.73.Final.jar:4.1.73.Final]
	at io.netty.channel.epoll.AbstractEpollStreamChannel$EpollStreamUnsafe.epollInReady(AbstractEpollStreamChannel.java:795) [netty-transport-classes-epoll-4.1.73.Final.jar:4.1.73.Final]
	at io.netty.channel.epoll.EpollEventLoop.processReady(EpollEventLoop.java:480) [netty-transport-classes-epoll-4.1.73.Final.jar:4.1.73.Final]
	at io.netty.channel.epoll.EpollEventLoop.run(EpollEventLoop.java:378) [netty-transport-classes-epoll-4.1.73.Final.jar:4.1.73.Final]
	at io.netty.util.concurrent.SingleThreadEventExecutor$4.run(SingleThreadEventExecutor.java:986) [netty-common-4.1.73.Final.jar:4.1.73.Final]
	at io.netty.util.internal.ThreadExecutorMap$2.run(ThreadExecutorMap.java:74) [netty-common-4.1.73.Final.jar:4.1.73.Final]
	at io.netty.util.concurrent.FastThreadLocalRunnable.run(FastThreadLocalRunnable.java:30) [netty-common-4.1.73.Final.jar:4.1.73.Final]
	at java.lang.Thread.run(Unknown Source) [?:?]
We are running the benchmarking tool which keeps starting PI’s till the back pressure crosses the threshold which in our case is set to 0. With 5 brokers and 5 partitions we have seen the tool starting around 180 PI/s. Wonder why this issue doesn’t appear with 4,3 or 2 brokers?
We run only one container of this tool so 1 client instance.
But like the github issue reports this doesn’t seem to be just logspam because we have seen the zeebe engine not executing any processes there after and the “completed PI/s” metric goes down to zero. Though this is not always reproducible. Sometimes the processes do keep getting completed too.
Any workarounds like configuring the maxConnectionAgeGrace?
I know that @falko.menge has run several benchmarks with higher broker counts, maybe he has encountered something similar, but tbh I doubt it.
If you start a cluster with 5 nodes it doesn’t fail all the time as far as I understood. If it fails does it stop failing at some point again? And the request goes through again?
I just did another run with 5 brokers, 5 partitions and 1 replication factor. We didn’t observe this stream error on the gateway. There are two observations
The completed PI/s dropped from 180 to 53 though. I wonder why because follower partitions don’t participate in process execution right? So the number of leader partitions were the same between the two runs.
The CPU limit configured on the zeebe broker is 3.5 (values.yaml) and I see the recommendation is to have 2 cpus per partition. With our previous run (replication factor 2) we had 2 partitions per vm and just 3.5 cpus. Could the cpu shortage lead to the “stream error”?
One question - When the load increases (as seen with 5 brokers), due to this issue (one gateway is always preferred) couldn’t the gateway close connections and lead to the stream write errors?