broker version:0.26.0
env: k8s
Issues that have been read:
Unexpected high memory usage on long running benchmark · Issue #4812 · camunda-cloud/zeebe
Profiling zeebe for memory usage · Issue #5736 · camunda-cloud/zeebe
From the issue above, it seems that the high memory problem is caused by RocksDb. But when I actually analyzed it, I found that the ratio of the actual memory occupied by rocksDB to the entire memory is not very large. It seems that there are other components occupying the memory and are increasing. The specific analysis process is as follows:
Total memory:
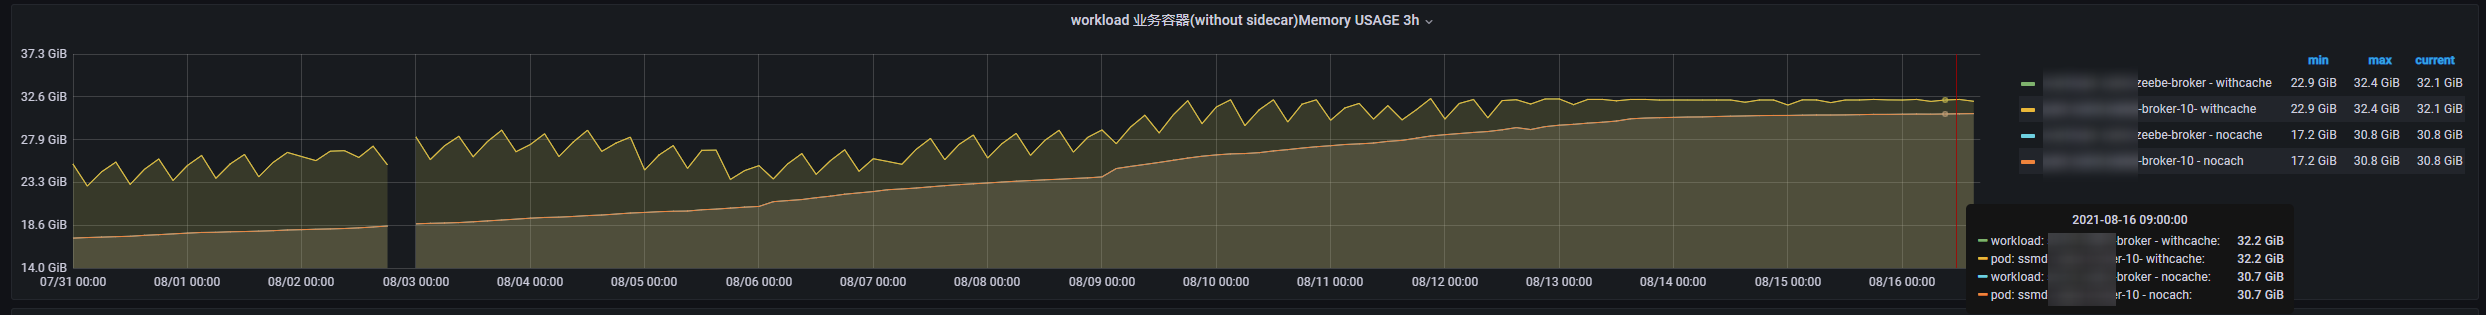
total memory(with no cache) almost is 30.8G
JVM meomry:
Total JVM memory (max) < 2G +1.5G = 3.5G ==> Has not changed much.
RocksDB memory:
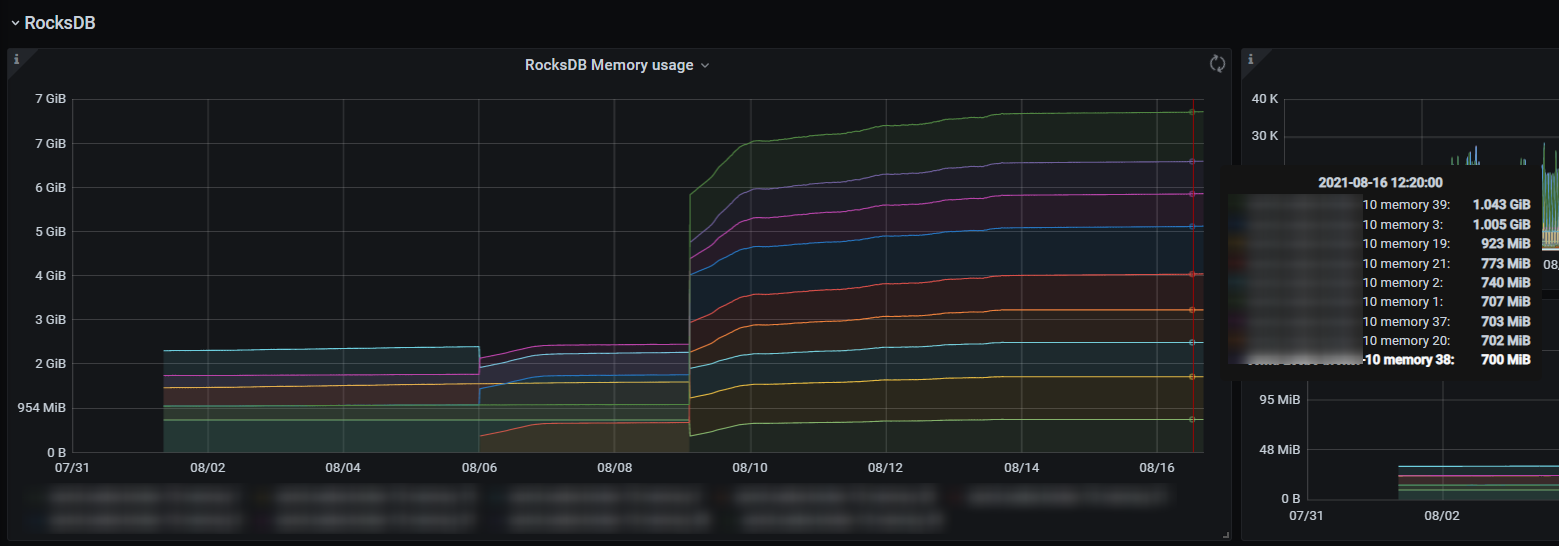
RocksDB memory < 7G
The memory that we can trace is:
JVM memory + RocksDB momory = 10.5G
We don’t know why 20.3G(30.8G - 10.5G) is used internally, and its usage has been increasing. Therefore, in order to solve the problem of increasing memory usage, in addition to limiting the memory usage of RocksDB, it seems that we also need to limit this part of the unknown memory space.
So I want to know what this part of the memory is occupied(eg: Atomix??), is there any way to limit it?