Has anyone intrumented their Spring boot applications for Open Telemetry(OTEL).
Currently we are working on an implementation where there are mlulitple spring boot microservices are in play and some of them have Camunda process engine embedded.
When we instrument the spring boot services with OTEL libraries, then we can see the traces end-to-end when there are multiple microservices in the flow . However we have never tried instrumenting a spring boot service having embedded Camunda process engine.
Has anybody did such intrumentation and how does the observability look like in that . Any help on this is greatly appreciated.
Are you using the Otel auto-instrumentation agent for Java or are you using the Otel SDK for manually instrumenting your Spring Boot services?
I would suspect that, by default, the auto-agent won’t trace the Camunda workflow because it is not one of the agent’s supported libraries. But if the services you invocate with Camunda are using libraries that are supported by the agent, it should track them, create spans for them, and put them in the overall trace context.
Do you like to create or see a span for each service task the Camunda process invokes? Or what would you be interested in tracing from the Camunda workflow perspective?
If you want to create spans based on the workflow I would play around with manual instrumentation. There is a Java Otel SDK for creating spans in your code and there is Micrometer that can be used as well.
I normally use Micrometer and its observation API (which is compatible with Otel). For me, it feels a little bit more intuitive to use in Springboot applications than the Otel SDK, but I think you can achieve the same with both APIs.
If you register the Micrometer observation API with Aspect:
  @Bean
   public ObservedAspect observedAspect(ObservationRegistry observationRegistry) {
       observationRegistry.observationConfig().observationHandler(new SimpleLoggingHandler());

       return new ObservedAspect(observationRegistry);
   }
}
, you can simply annotate each service of the Camunda process:
@Observed(name="Camunda Task")
@Service
public class CamundaTask implements JavaDelegate{


  }
Each Service task will be then represented as a span insight into your trace. Not sure if that is something you were looking for? I would be interested in knowing how the outcome will be from your project .
I will suggest to try Java auto instrumentation agent. I had done a POC long back and I was able to see traces till Postgres DB for requests from Webapps and engine-rest.
All I had to do was add the agent jar in JAVA_OPTIONS and add few configurations.
It may work as Camunda uses many Apache libs/JAX-RS for web apis.
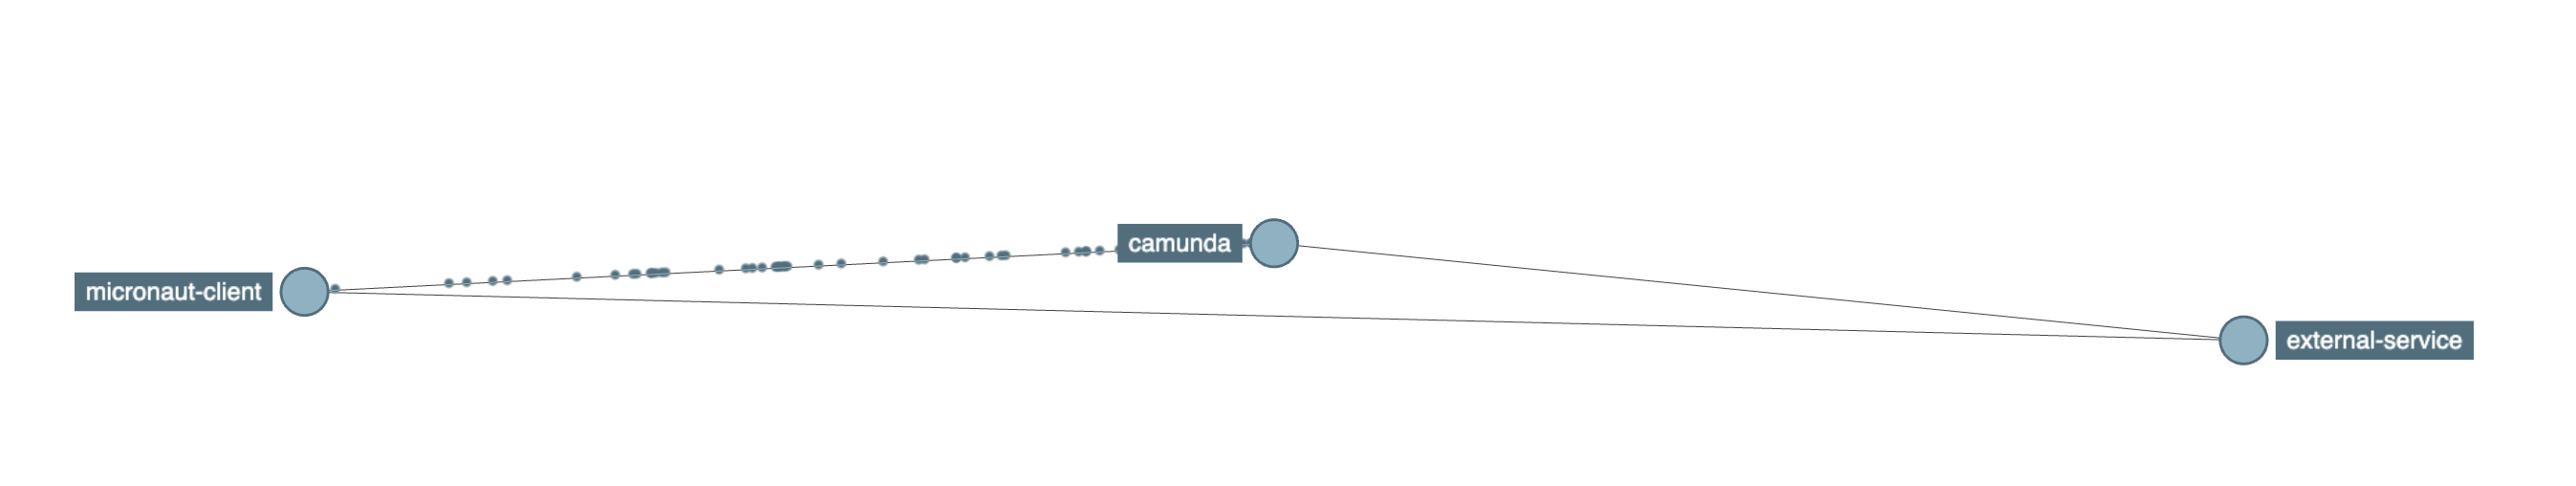
To monitor all these components and their interactions I added the OTEL Java Agent to each docker container they are running in. The Agent collects as much information as you want. Using APM Tools like Jaeger, Zipkin or Prometheus you could monitor and analyze them.
Thanks @ lwluc . This helps .
And as per you setup if we have multiple external workers and multiple spring-boot applications each having their own BPMN flows , will this setup show the traces end-to-end flow .
This definitely help to get us started , but curious to know if the above sceanrio also will fit in this architecture.
yes I think this will also help you with your architecture (embedded engine).
You could annotate specific methods which may not be traced with @WithSpan and the OTEL agent will observe them.
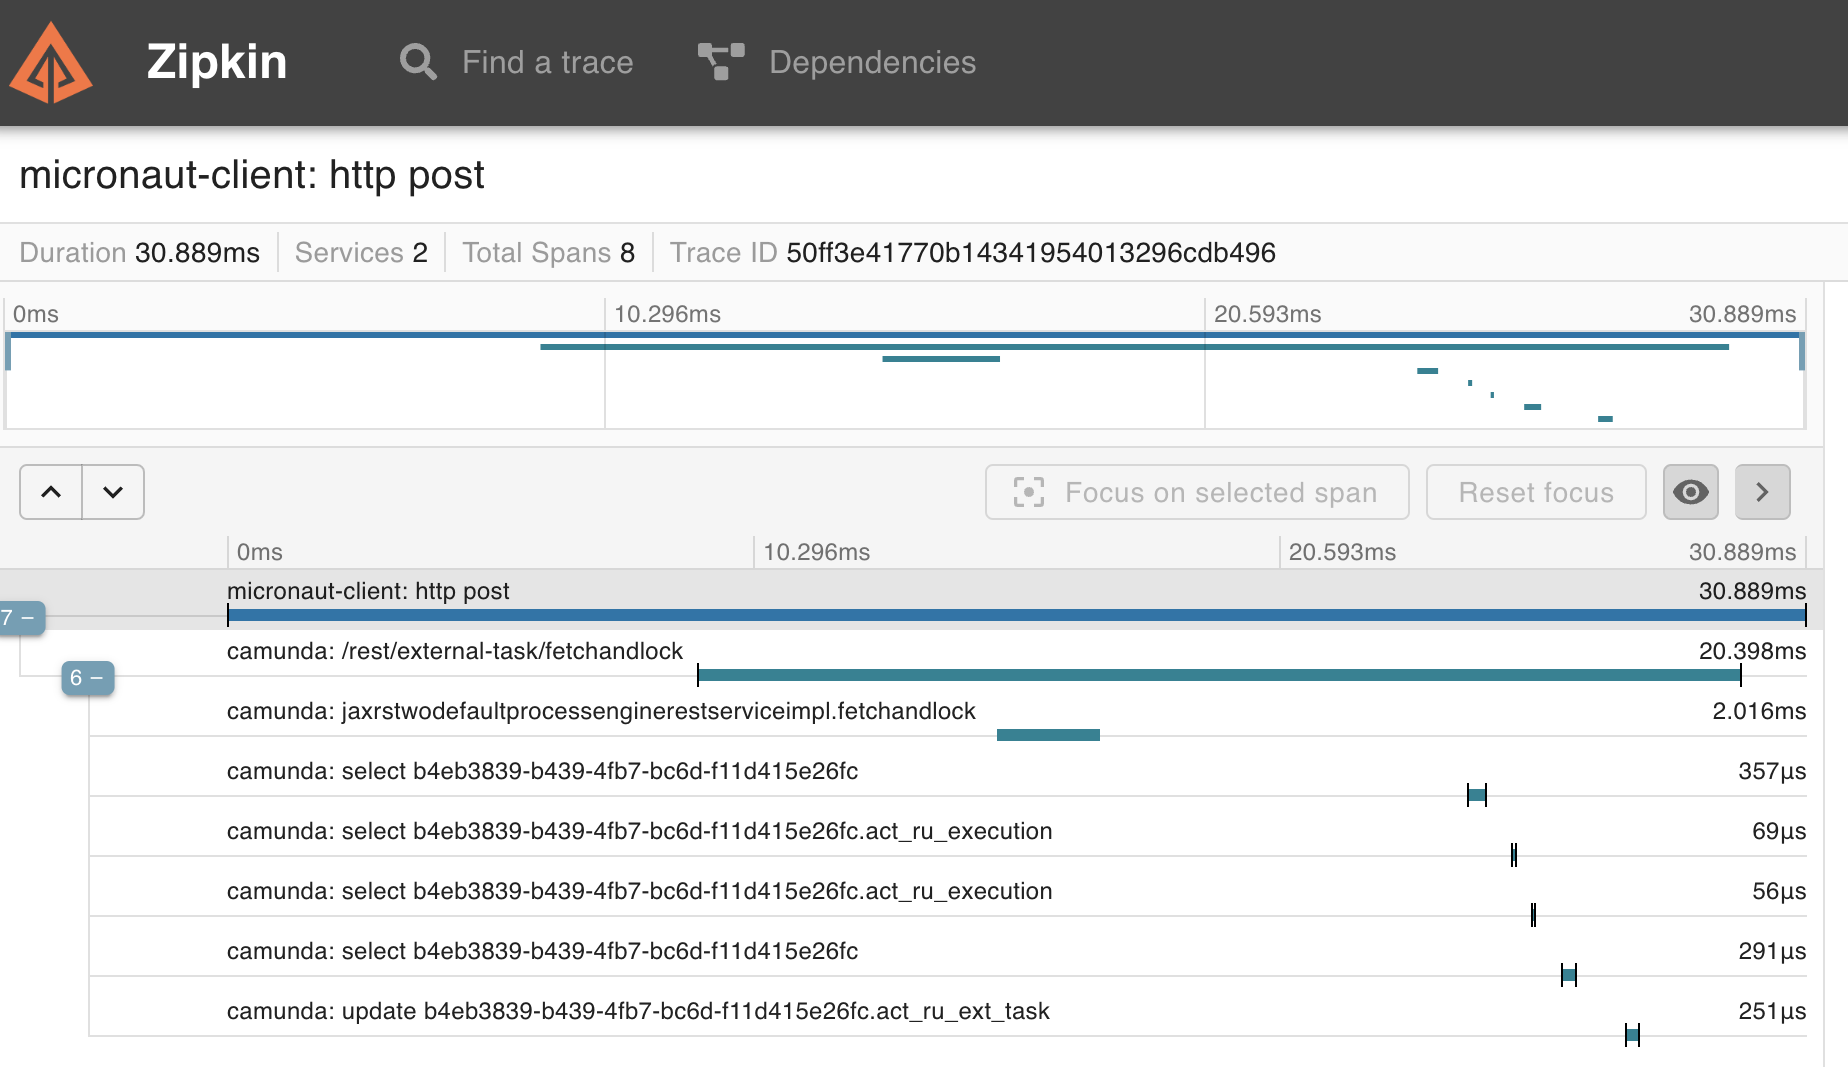
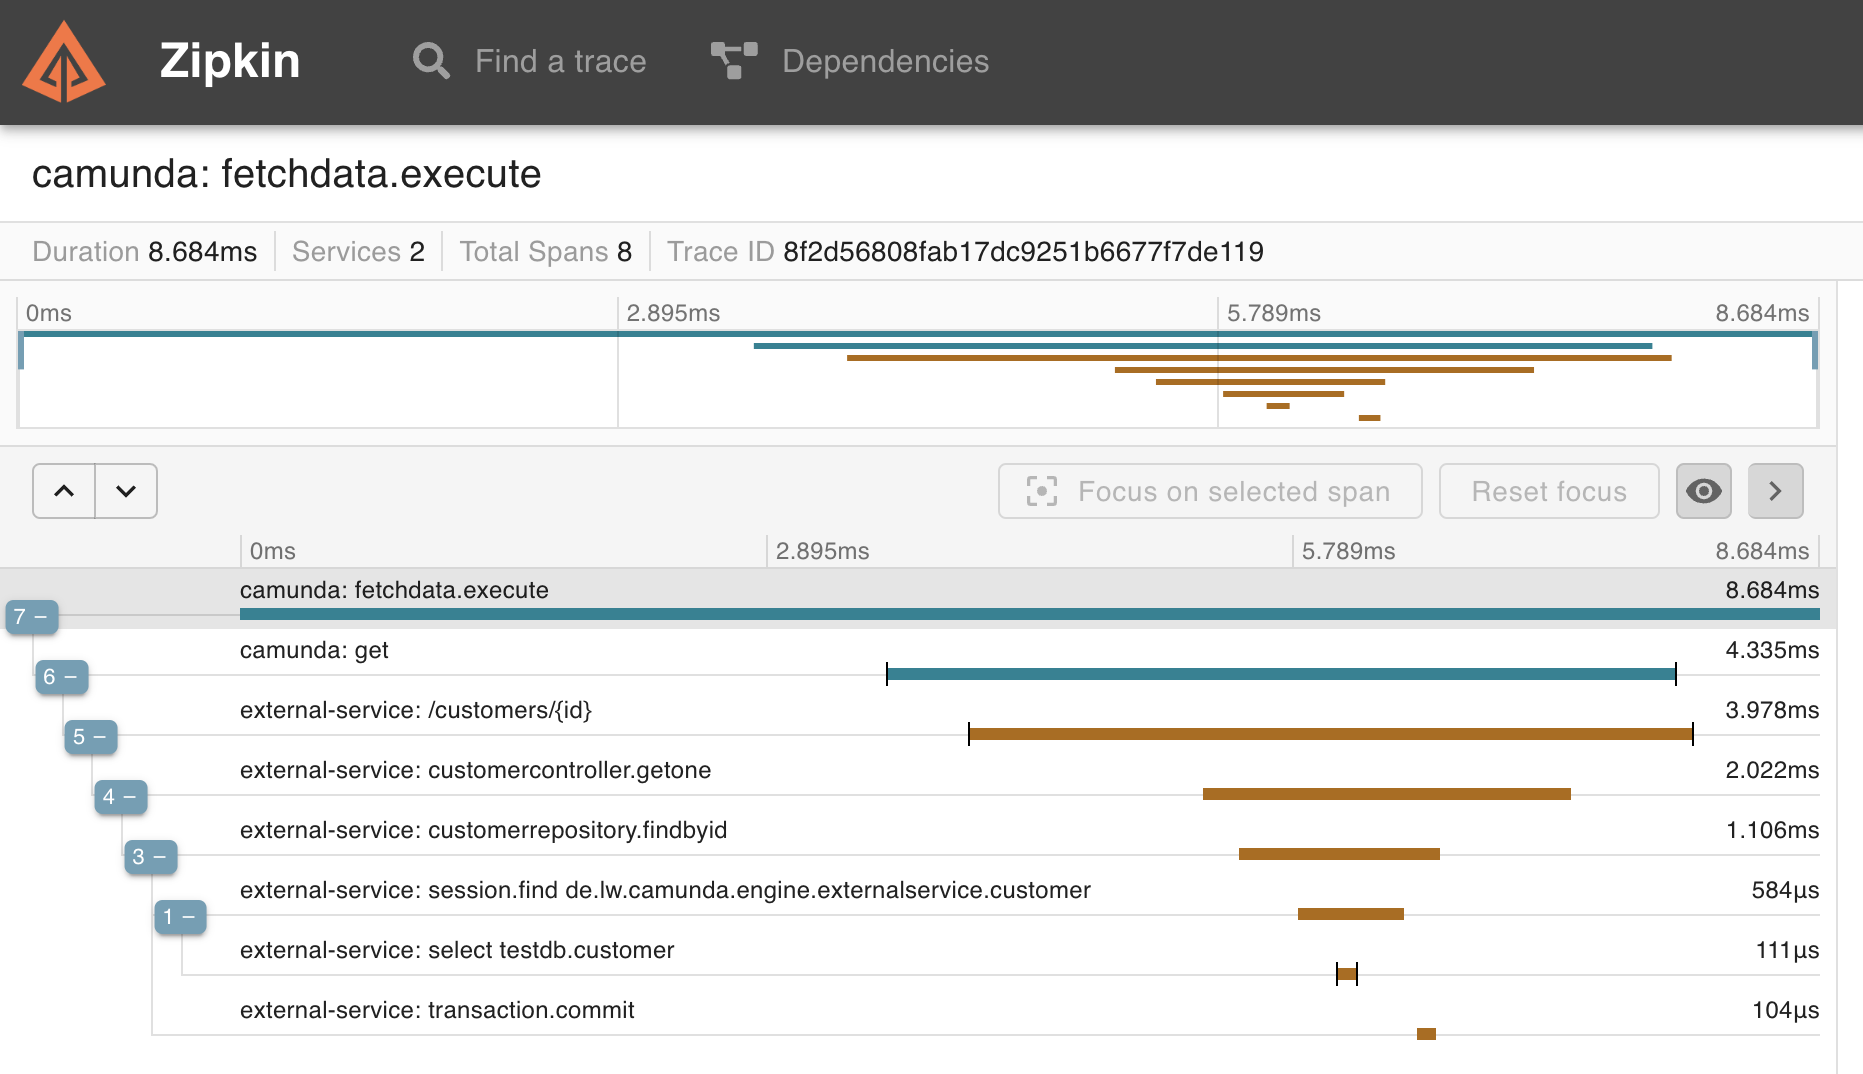
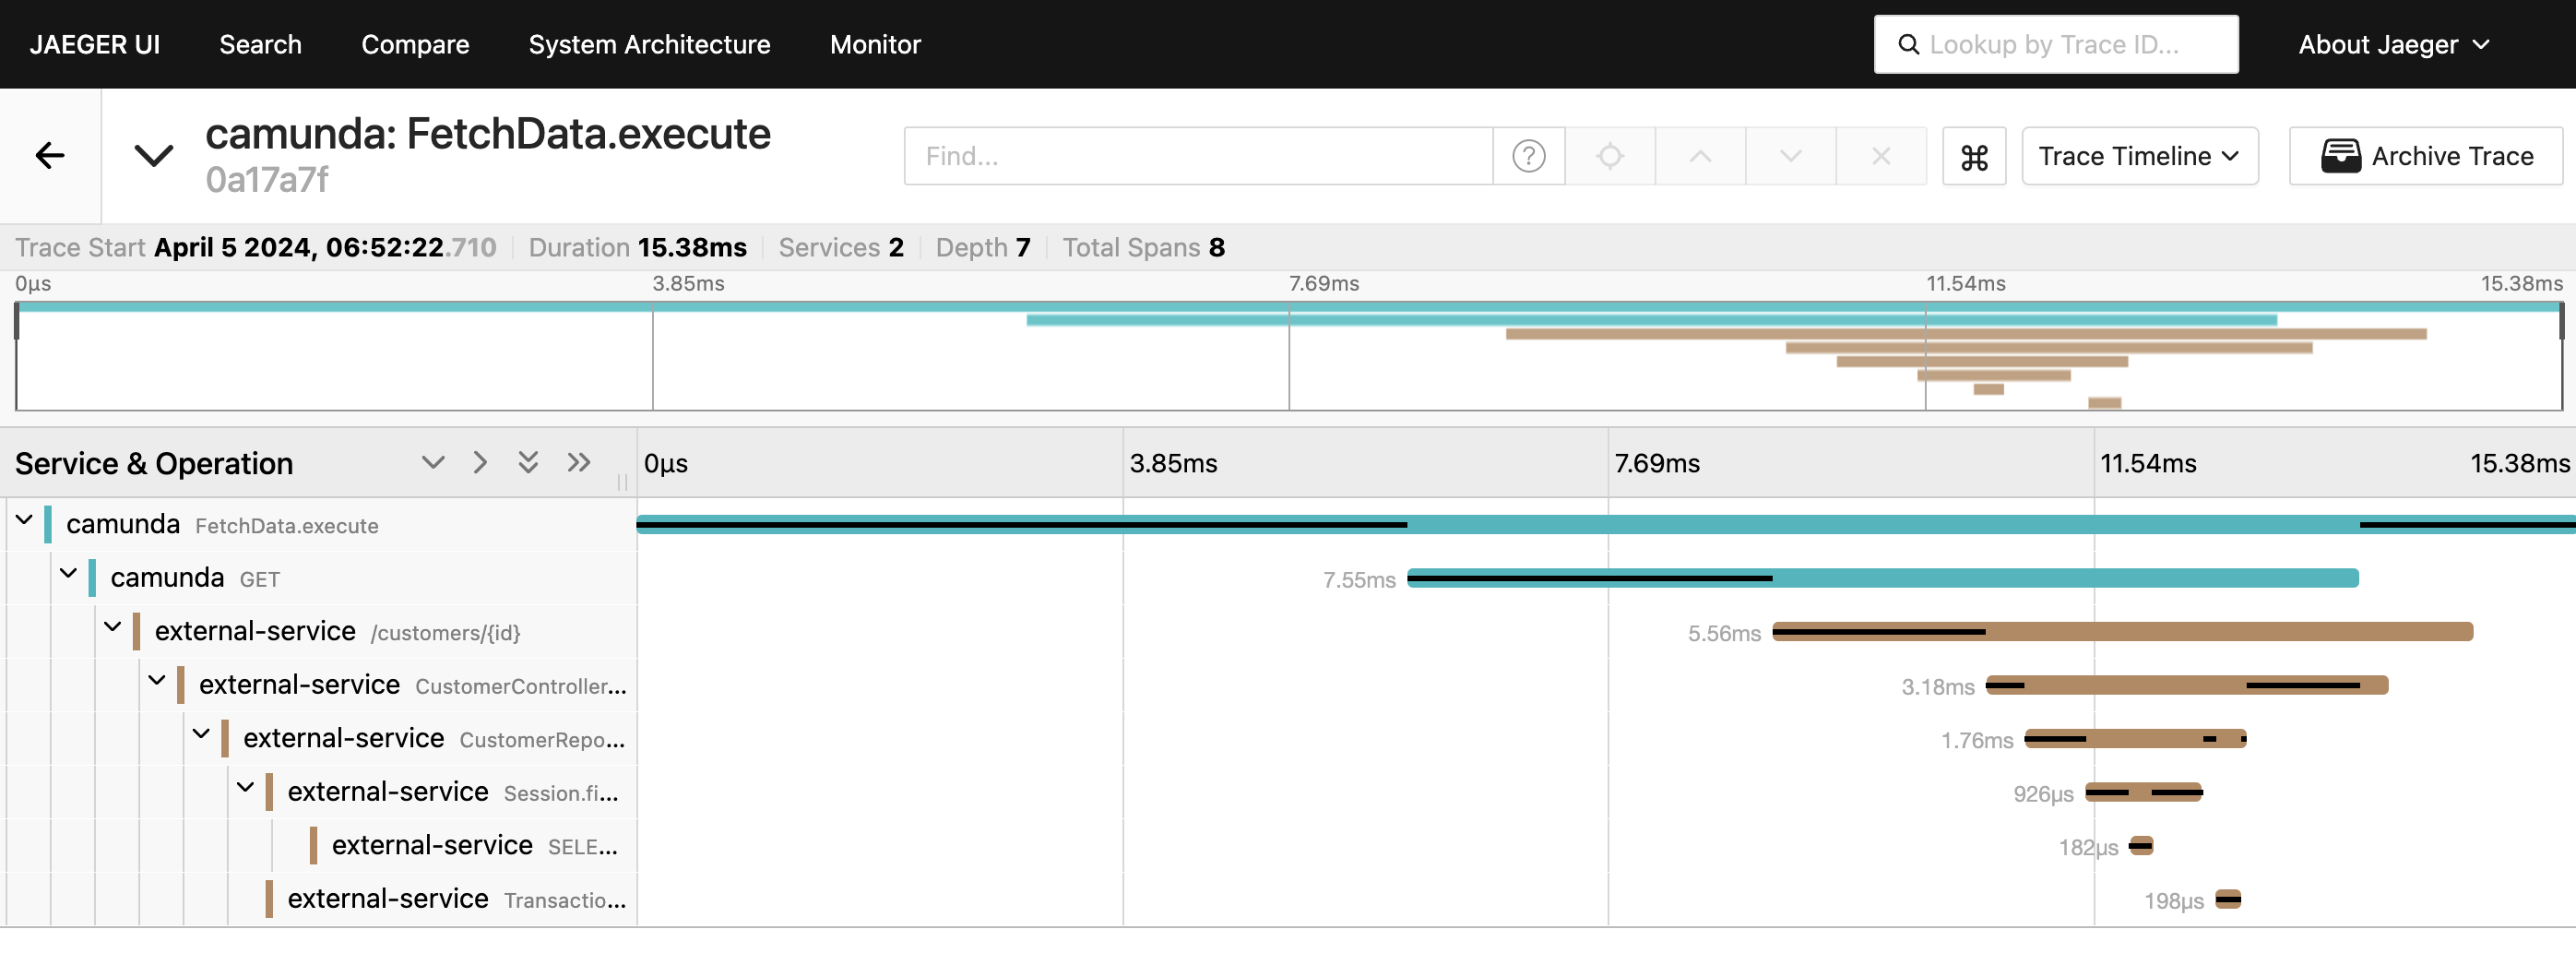
I’ve done this e.g. for the JavaDelegate in my example repo (see my last commit). Resulting in a span for the execute method of the JavaDelegate (sample screenshots of Jaeger and Zipkin):
I tested the example application that you shared @lwluc and thanks for providing that. However what I saw is that the traces are shown for the external micronaut client to the service it is being called. Somehow I do not see the traces originating from the camunda engine.
How did you instrument the Camunda application from the the process is started ? Please share you suggestion on instrumenting an app with embedded engine.