Issue with Camunda 8 installation

Hi Team,

I was trying to install Camunda 8 on Kubernetes cluster through helm chat by referring link: Camunda Helm charts | Camunda Platform 8

Please check the result for “kubectl get pods” in attached image (kubectlGetPod_image.PNG).


I have created only one master node. Can you please help me understand why camunda8-zeebe is not starting. I don’t see any error in log file.

Or please suggest any reference to troubleshoot.

Thanks,
Sudhanshu Dash

Hi Sudhanshu Dash,

If I remember correctly, it’s recommended to run the Camunda 8 Helm Charts on Clusters with at least three nodes.

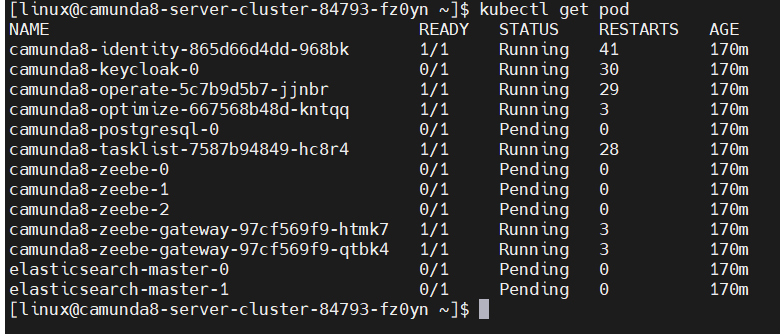
Besides this, you may check the logs of the pods and the applications to get additional information on the error/problem that is preventing the start up.

It looks like there are three broker nodes there. But what are the log messages in the failing containers?

Do they have sufficient resources? That can do it.

Josh

1 Like

0/1 nodes are available: 1 node(s) didn’t match pod affinity/anti-affinity rules, 1 node(s) didn’t match pod anti-affinity rules.

As Stephan Haarmann suggested, I’m going to add 2 ore nodes.

–Sudhanshu

Hi @StephanHaarmann,

This time I installed camunda 8 on a three node cluster.
I don’t see any error in putty console while execued “helm install camunda/camunda-platform”.

Here is the output of kubectl get pod

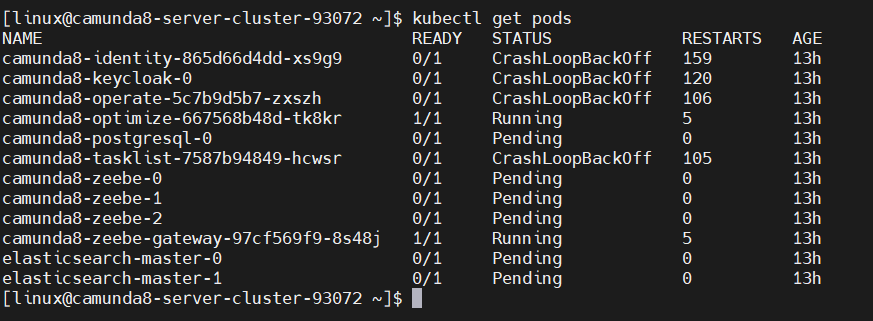
Also on my cloud console, under Workloads-> Deployment I can see “camunda8-zeebe-gateway”, “camunda8-tasklist”, “camunda8-optimeze”, “camunda8-operate” & “camunda8-identity” status is runnig.

Then why all the pods are not in running state?
If there is any issue with the pod status as Pending then please let me know the procedure to troubleshoot.

Thanks,
Sudhanshu Dash

Hi,

As pointed out by @jwulf, this issue may be caused by insufficient resources.
To trouble shoot the issue, you can use kubectl describe pods <name_of_your_pending_pod>. You should find messages from the scheduler.
For pods that are running but not ready, you may look in the applications’ logs (i.e., the log of keycloak).

Hi @StephanHaarmann and @jwulf,

I pulled camunda/camunda-platform tar file and unzip that file. And then I update values.yaml and did the install form my /tmp dir.

Now I can see all the pods are running.

[linux@camunda8-server-cluster-84793-fz0yn ~]$ kubectl get pods -n camunda8
NAME READY STATUS RESTARTS AGE
camunda8-identity-865d66d4dd-5vqxp 1/1 Running 2 36m
camunda8-keycloak-0 1/1 Running 0 36m
camunda8-operate-5c7b9d5b7-fh6d6 1/1 Running 0 36m
camunda8-optimize-667568b48d-grksb 1/1 Running 0 36m
camunda8-postgresql-0 1/1 Running 0 36m
camunda8-tasklist-7587b94849-2rntl 1/1 Running 0 36m
camunda8-zeebe-0 1/1 Running 0 36m
camunda8-zeebe-1 1/1 Running 0 36m
camunda8-zeebe-2 1/1 Running 0 36m
camunda8-zeebe-gateway-97cf569f9-qdt2m 1/1 Running 0 36m
camunda8-zeebe-gateway-97cf569f9-rczhn 1/1 Running 0 36m
elasticsearch-master-0 1/1 Running 0 36m
elasticsearch-master-1 1/1 Running 0 36m

Thanks,
Sudhanshu Dash

2 Likes

Hi @StephanHaarmann and @jwulf,

Now all the components of camunda 8 is running.
But I’m not able to access cockpit/optimize in browser. I’m getting error “request time out”.

Any suggestion will be appreciated.

Thanks,
Sudhanshu Dash