Job Executor: Camunda stops doing anything

Hi everyone, I wanted to share a problem I have with the Camunda Engine that i think has to do with Job Executor.

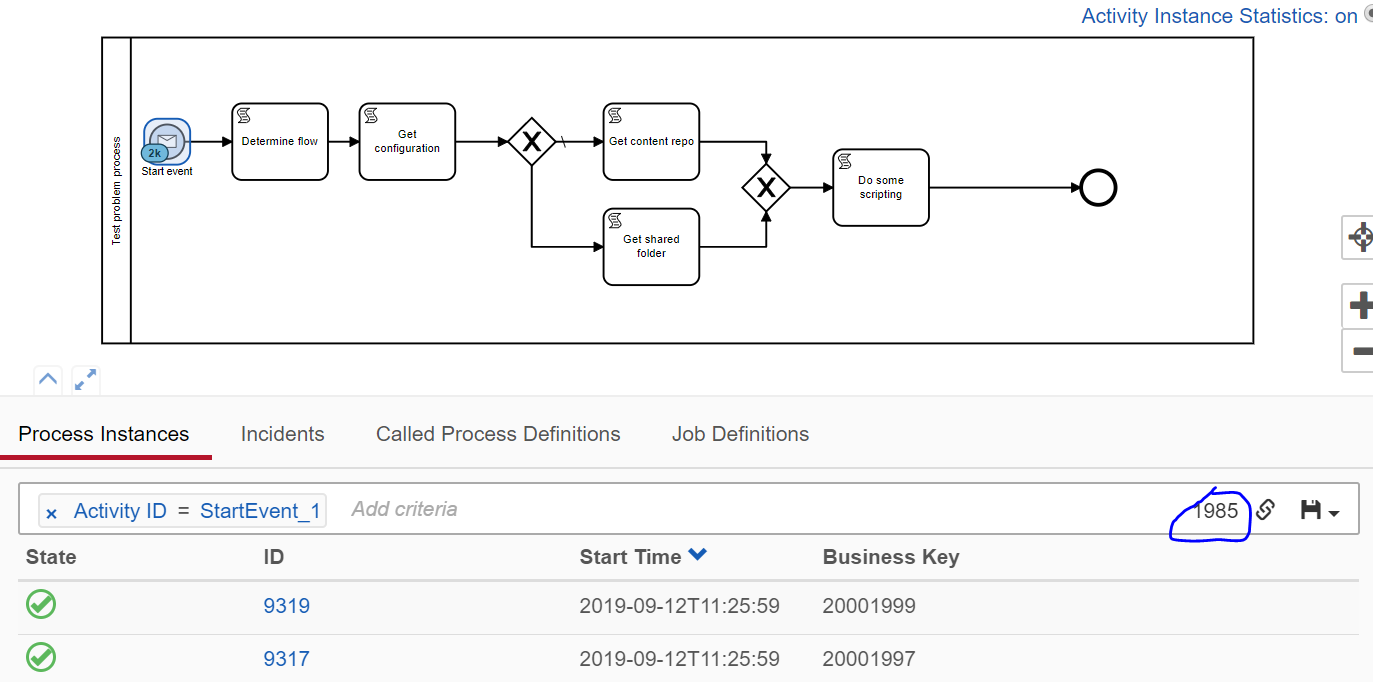
I have a process that starts with Message Event and then i have few Service tasks after. After some number of active proceses (sometimes 500, sometimes 2500) camunda just stops doing any jobs on that process. Since i have Async after on the Message Event in Cockpit it is just showing (1) on Message Event and it is stuck there (No exceptions in log, no information, no incidents).

After this happens to one process, any other jobs on new process instances get stuck on the same step until i do the restart of Engine. When i restart the engine Camunda starts doing stucked processes and they eventually all come to end.

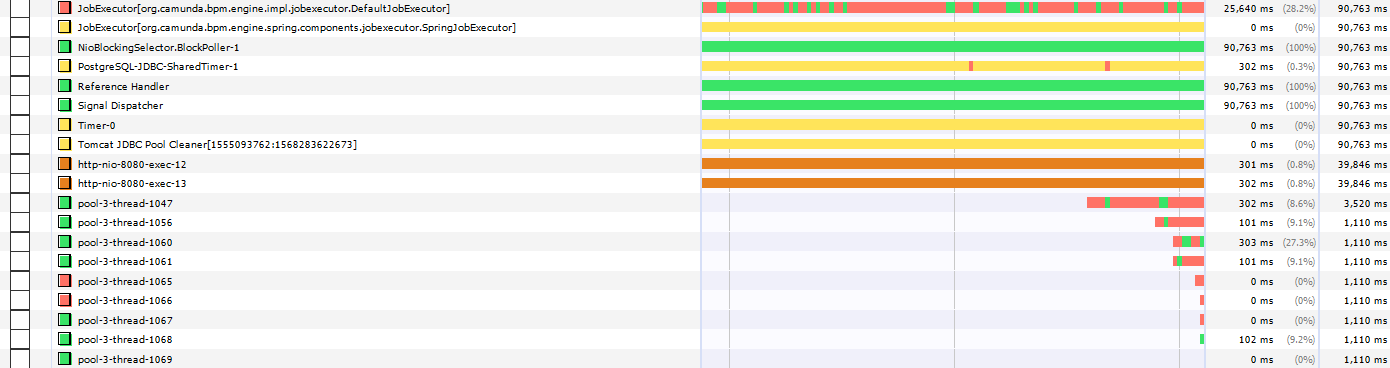
My idea was that the issue with Job Executor so I changed the configuration of Pool of Job Executor from min: 25 max 50 to min 10 max 20 and it seems that lowering the pool actually postponed the stucking from max of 1000 process instances running to 2500 process instances running so i decided to give default values to Job Executor 3 min and 10 max and now 5000 process instances are run without any stucking issue.

Does anyone know why the process is stuck if the Pool for Job Executor is higher.

I tried Camunda 7.10.0 and 7.11.0 with Java 11 (OpenJDK). Camunda is running on Spring Boot 2.1.5, 3.3.1 (Camunda Spring Boot Starter).

The CPU has 10 core and HT.

Update: I found on forum that the simular problem appeared when Http connector did not have timeout. We are using custom http delegate that prints out all request in log so there is no active request in log when this happens

In logs i found this when the job executor stops doing processes:

Acquired job with id ‘1068’ not found.

What this means?

Hey,

It’s likely that all the job executing threads are stuck (e.g. in a HTTP call that never returns as you mention). Make a thread dump once its stuck to see what the job executor threads are doing.

Cheers,
Thorben

Hi Thorben,

I removed all HTTP calls from process. Now process has Start event and then after few simple script tasks simulating some work. I am sending 2000 start events to Camunda and only first 16 gets done after it gets stuck. I can upload the process. I am starting process with rest api calling it 2000 times. I also tried via message broker since i have it catching messages and same thing happens

Here is the picture from Cockpit and also i am attaching process that i am testing with.

The issue happens faster if larger amount of processes is Started. I have async after on Start event. There are no incidents. Only first 15 instances get executed fully.

This part of log seems strange to me:

2019-09-12 11:35:02 [Debug] ENGINE-03009 SQL operation: 'INSERT'; Entity: 'HistoricProcessInstanceEventEntity[id=1099]'
2019-09-12 11:35:02 [Debug] ==>  Preparing: insert into ACT_HI_PROCINST ( ID_, PROC_INST_ID_, BUSINESS_KEY_, PROC_DEF_KEY_, PROC_DEF_ID_, START_TIME_, END_TIME_, REMOVAL_TIME_, DURATION_, START_USER_ID_, START_ACT_ID_, END_ACT_ID_, SUPER_PROCESS_INSTANCE_ID_, ROOT_PROC_INST_ID_, SUPER_CASE_INSTANCE_ID_, CASE_INST_ID_, DELETE_REASON_, TENANT_ID_, STATE_ ) values ( ?, ?, ?, ?, ?, ?, ?, ?, ?, ?, ?, ?, ?, ?, ?, ?, ?, ?, ? ) 2019-09-12 11:35:02 [Debug] ENGINE-13005 Starting command -------------------- ExecuteJobsCmd ----------------------
2019-09-12 11:35:02 [2019-09-12 11:35:02 [Debug] ENGINE-13005 Starting command -------------------- SuccessfulJobListener ----------------------
2019-09-12 11:35:02 [Debug] ENGINE-13009 opening new command context
2019-09-12 11:35:02 [Debug] ENGINE-14001 Acquired job with id '131' not found.
2019-09-12 11:35:02 [Debug] ENGINE-13009 opening new command context
2019-09-12 11:35:02 [Debug] ENGINE-14001 Acquired job with id '131' not found.
2019-09-12 11:35:02 [Debug] ENGINE-13011 closing existing command context

I don’t know why this Acquired jobs are not found.

I also found this

[WARN ] 2019-09-12 11:55:02.027 [pool-3-thread-5] jobexecutor - ENGINE-14006 Exception while executing job 152:
java.lang.NullPointerException: null
at org.camunda.bpm.engine.impl.pvm.runtime.PvmExecutionImpl.getNonEventScopeExecutions(PvmExecutionImpl.java:1041) ~[camunda-engine-7.11.0.jar:

test proces camunda.bpmn (8.3 KB)

Update:

Here is a thread dump:

I guess the pool-3 are Job Executor threads. They are deleted and new onces are being created every seconds as i can see. So basically they are started and closed without doing anything

UPDATE: Tested with MSSQL, Postgres and H2 database. Same thing happens. Also tested ID Generation simple and strong same happens.

UPDATE 2: Tested with Java 1.8 and 1.11 same issue

I just tested on Apache Camunda version (without Spring boot) 7.11 and this works fine.
Also i tested Spring Boot new project with no custom configuration and this process works fine also but when i put custom configuration as is in example ( Configure the Process Engine) here:

it starts acting like this. What is the reason this happens. Which configuration can affect this behavior ?

I have some kind of similar effect in one environment.
Did you find the reason @vuk.vasic ?

I suspect it is the setting
camunda.bpm.job-executor-acquire-by-priority=true

Commenting it out the proccessing continiued …

@vuk.vasic
Seeing a similar issue in camunda (v7.10.0) with camunda-spring-boot (v3.2.0), mariadb(v10.1.24). I found an issue with familiar symptoms but in Activi 6.0 here Activiti 6 process async.

I know the codebase was forked but could it be a similar issue?

@bmaehr
In which file did you find this setting : camunda.bpm.job-executor-acquire-by-priority=true
I am using tomcat engine

Hi @teja_polisetty,

for the tomcat distro you use the bpm-platform.xml: Install the Full Distribution on a Tomcat Application Server manually | docs.camunda.org

Hope this helps, Ingo

1 Like