Jupyter Lite as Camunda (>= 7.14) Cockpit Plugin

Jupyter Notebooks are popular tool in data science for manipulating and visualizing data. Another popular use case is learning new programming languages. In addition, Robocorp has adopted them as a tool for authoring RPA bots. Jupyter Lab is the currently maintained Notebook environment by Project Jupyter. Finally, Jupyter Lite is a JupyterLab distribution that runs entirely in the web browser, backed by in-browser language kernels.

How that all relates to Camunda Platform?

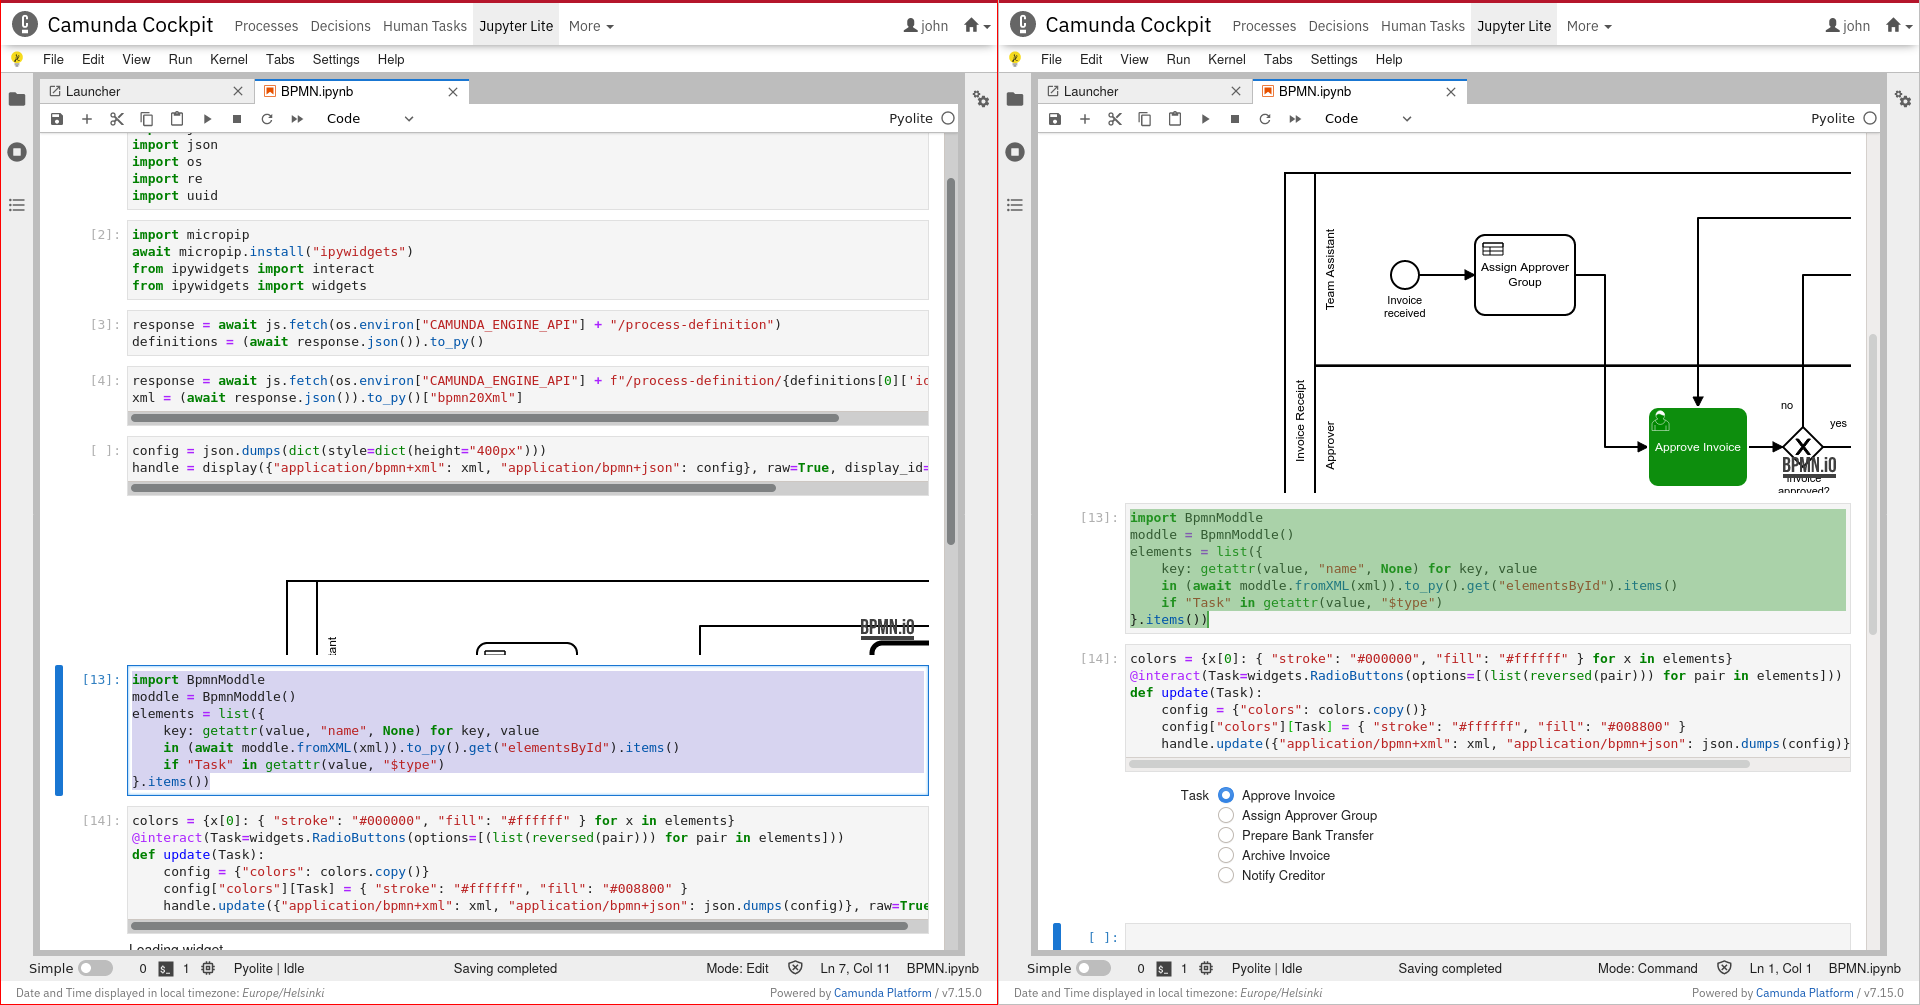
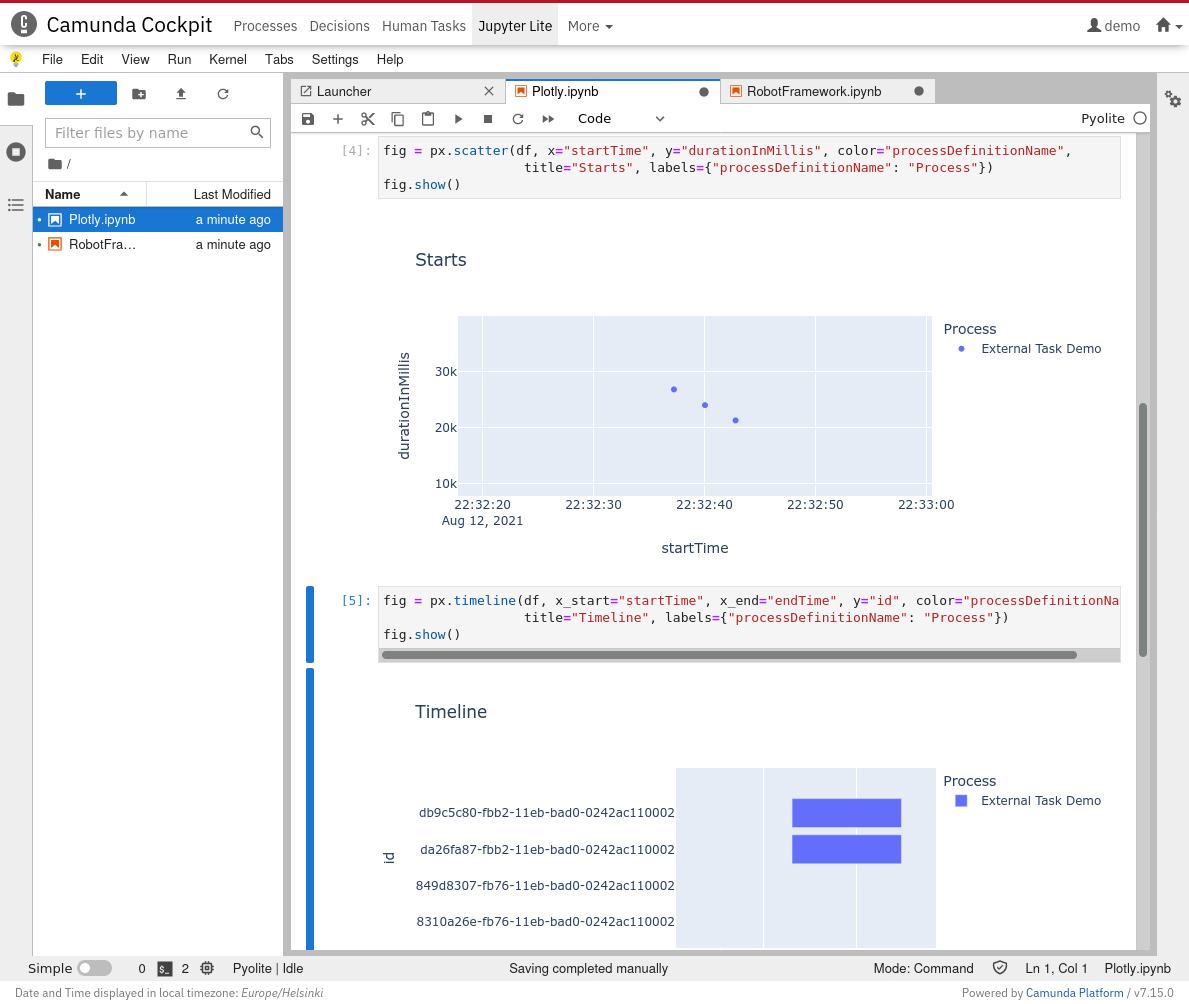
Because Jupyter Lite runs completely in browser, it can be packaged as a simple new style Camunda Cockpit Plugin. Even it is still in very early alpha, with slow startup times and many other quirks, and requiring a modern browser, it opens interesting possibilities… for example:

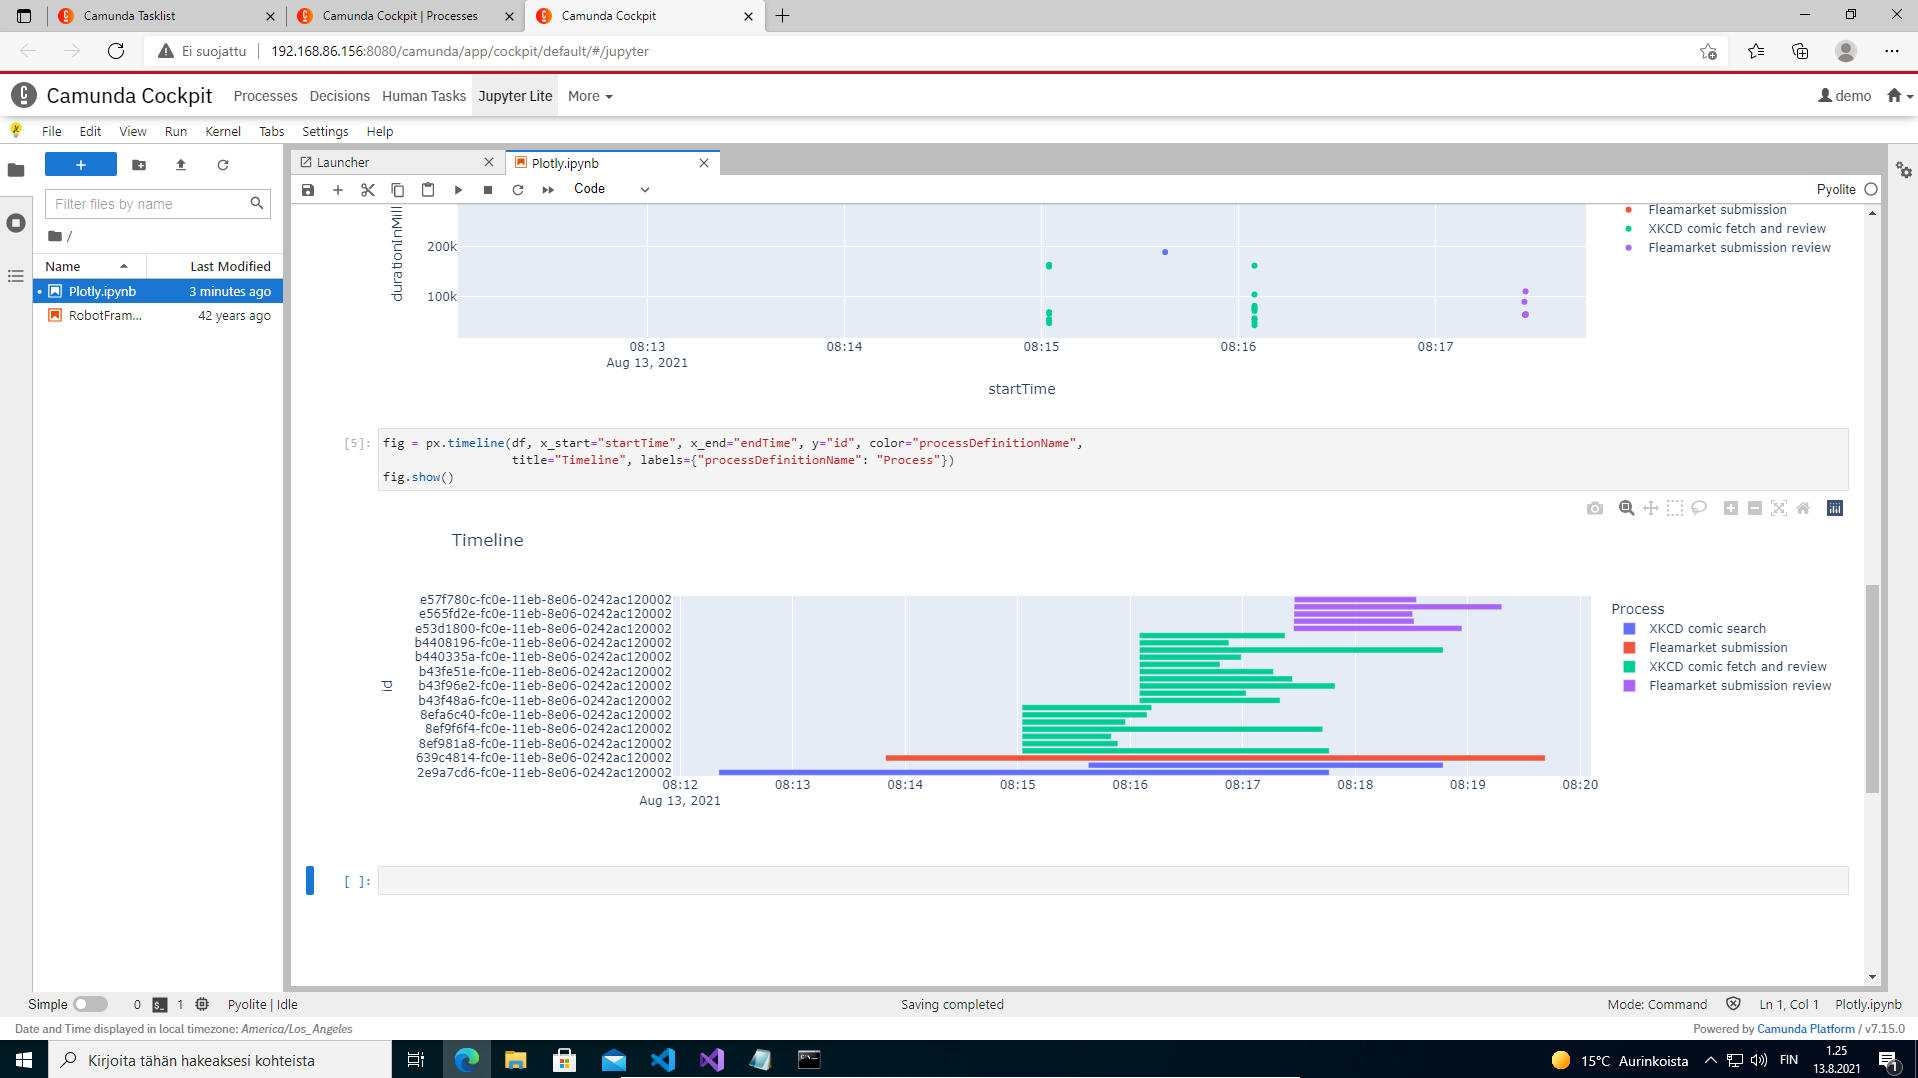
Analyzing history data directly at Camunda Community Cockpit

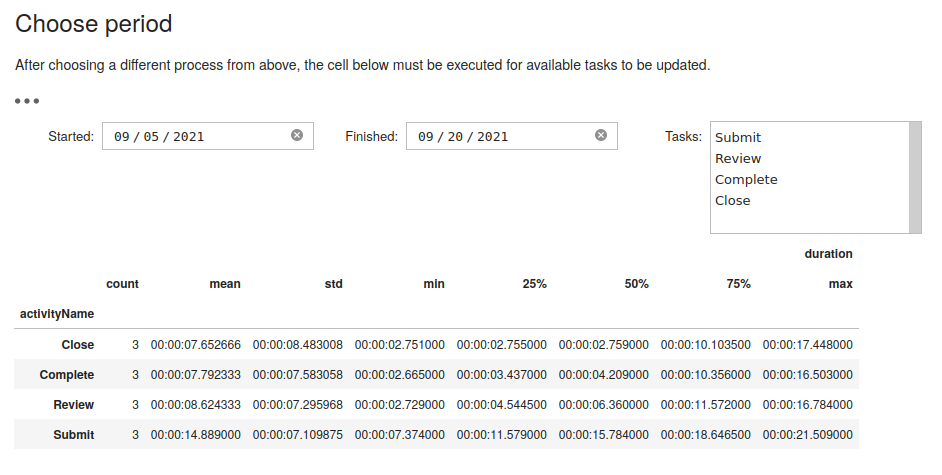
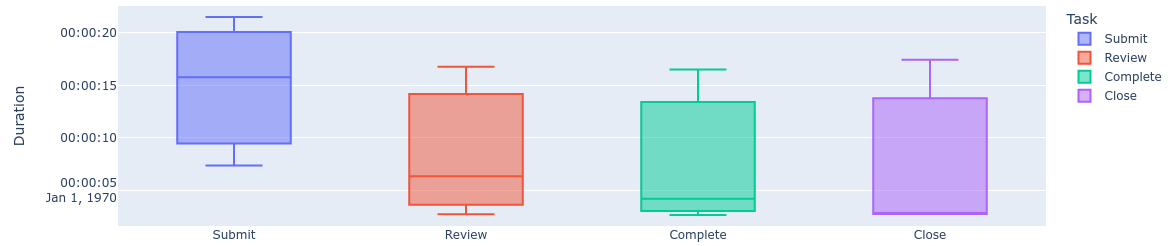
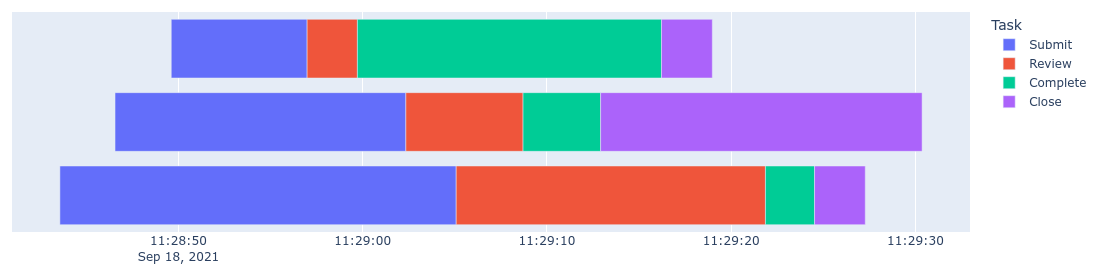
Jupyter Lite can fetch data from Camunda REST API and supports state of the art data science libraries like pandas for data manipulation and either matplotlib or plotly for visualization.

Maintenance scripts

Write ad-how maintenance / migration scripts as Python notebooks, save executed notebooks as logs and make clear copies of them for further use (or to share with others).

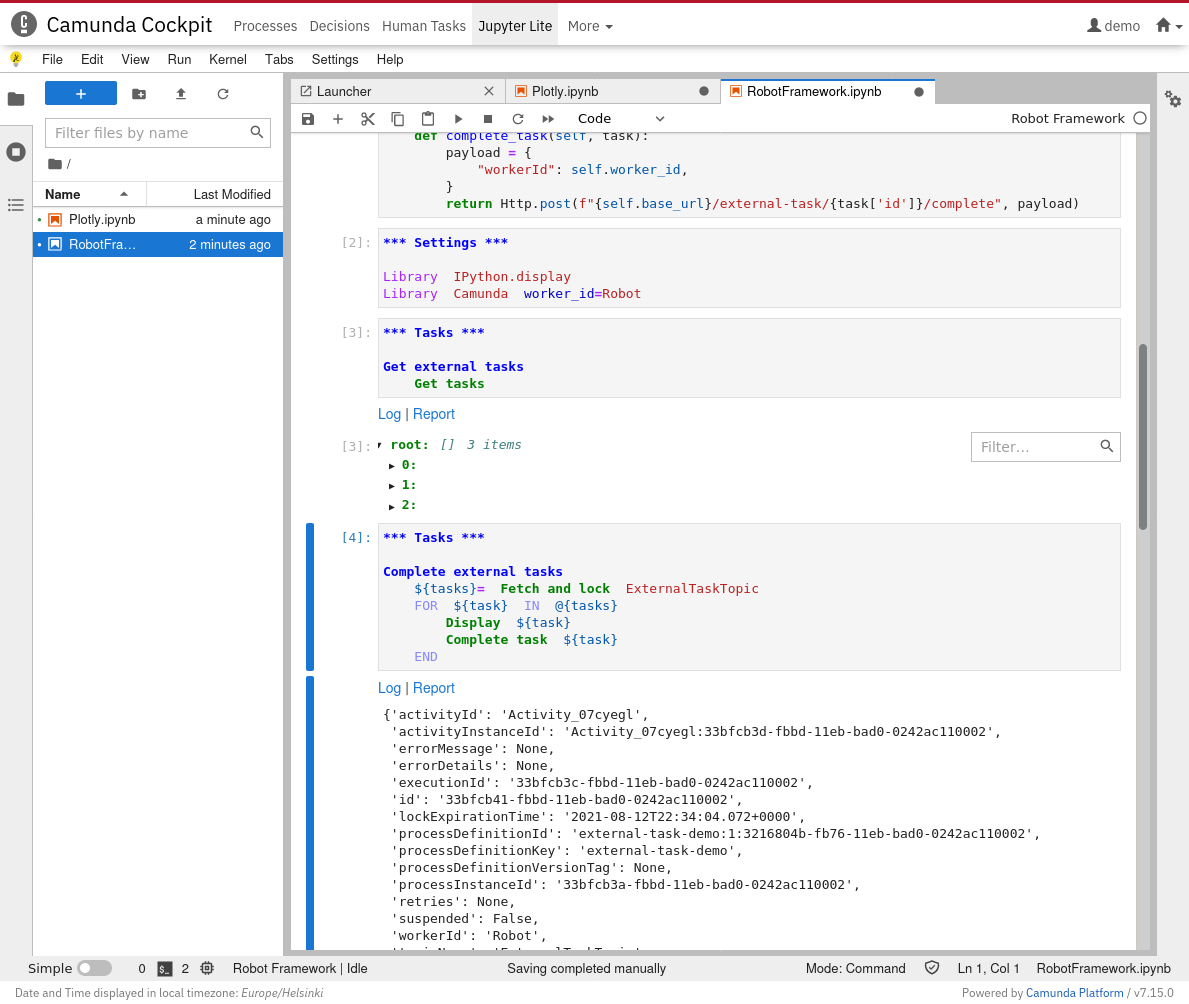
Learning external tasks and Robot Framework

In addition to Python, it can also execute Robot Framework code for learning it and playing with external tasks.

For that it is not as great yet, because it can only interact with the outer world (supporting CORS) by using browser’s synchronous XMLHttpRequest. Therefore it cannot use @Noordsestern’s robot libraries yet. But this might change in the future…

Consider this “technology preview”. It does include the example notebooks shown above, but I’ll try to add more and better examples, once I have more time to play with it also by myself.

7 Likes

This is amazing! So basically you have full IDE support in Camunda UI! Aside having external task worker being administrating within Camunda platform, I could make all kind of analysis and data visualization by connecting through (right now python) to Camunda database.

This is extremely powerful! And seeing frequent commits in jupyter lite on GitHub, I believe performance issues will be solved soon.

I don’t dare to express how excited I am, otherwise spam prevention bots might block me from the forum :grimacing: Wonderful times! Watch this thread! :partying_face:

2 Likes

Great looking work

@datakurre Great work :slight_smile:

Here’s an example Docker setup for building a test image with both my history plugin and this:

That project includes also a couple of demo processes, which I’ll probably use to write more Jupyter examples later.

1 Like

That’s really cool! I’d love to learn more about this.
How does it fit into your workflow?
What problems does it solve that you can’t through other options?

~ Eric
Camunda Optimize PM

At first, I am solely working with the Community Edition, so I am mostly unaware of the Enterprise features.

I am personally used to write small “automation” scripts as Jupyter Notebooks, share them and re-use them. I also prefer learning new things (e.g. languages or APIs) exploratively. Interactive notebooks support that approach very well, and “explorative sessions” can be later enhanced with markdown to be used as tutorials for others.

Of course, there are many ways to write and execute notebooks outside Camunda already, but inside Camunda I can re-use Camunda Cockpit session variables / tokens (passed by Camuda to Cockpit Plugins) making it very convenient.

The most obvious use case for me is simply learning while developing. Learning more about Camunda REST API while developing integrations. And then producing some interactive learning material for the other developers.

While developing processes with Camunda, there are times where running processes need to be “fixed”, migrated and old deployments to be cleared. Also every now and then unexpected things happens in production and process instances need to be manually “fixed” or migrated. Since all these can be done also on the Community Edition through Camunda REST API, Notebooks are convenient way to implement, document share and re-use these. And again, as a Cockpit Plugin, authentication is taken care of.

It remains to be seen, though, if history analysis is a good use case for this. Obviously, this only works for data that is still available in a single Camunda instance. So, possibly this is better for learning the data analysis than actually using for production data. Yet, my own deployments are still small enough for this…

But maybe the most exciting thing is that this brings Camunda history data trivially available in Jupyter Notebook environment, which is the data scientists’ computational notebook of choice, and for which the Internet is full of learning material. I am quite sure that in the near future, I will be using this myself to learn, how to use history data for ML training.

Wrote more thoughts at https://datakurre.pandala.org/2021/08/jupyter-lite/

1 Like

This is really great @datakurre - thanks for writing about it!

1 Like

Thanks for the info @datakurre!

It’s still too early-stage for us to seriously start planning this feature into the core product. However, if you see overwhelming interest and have a successful prototype, then feel free to reach out and we can talk more.

Keep it up!

:+1:

This is still too early-stage for us to use this in production large :wink: And I don’t see personally, why features like this should ever be in core when they work well as plugins.

For everyone here, it is good to know, that the current versions relies still on third party CDNs (one for WebAssembly compiled Python packages and the other for “pure-Python” packages). This will be fixed eventually in upstream. JupyterLite core developers have better “customization tools” on their roadmap and that includes builds not depending on CDN. (The downside is that it will result a plugin with ~ 100 MB of resources.)

4 Likes

Added initial BPMN and DMN rendering

also published as generic jupyter lab plugins

My intent is to add some kind of declarative annotation support for the BPMN rendering later to make it possible to use it for visualizing history data for reporting. Within the limits of bpmn-js.

2 Likes

This is how declarative annotations to be implemented in jupyterlab-bpmn would work. Together with Jupyter widgets they would allow somewhat interactive BPMN visualization based on the data fetched from Camunda.

output

(The BPMN rendering implementation does preserve state and only re-imports XML if it has changed.)

2 Likes

Friday update :wink:

jupyterlab-bpmn now saves SVG rendering into notebook, which allows viewers (e.g. GitHub) to render static notebook files with BPMN jupyterlab-bpmn/example.ipynb at main · datakurre/jupyterlab-bpmn · GitHub

And the Binder link for temporary JupyterLab with a BPMN example works now: Binder

2 Likes

Because “Pyolite”, the Python kernel in JupyterLite, is based on WASM compiled Python (pyodide), it is technically capable of proxying JavaScript libraries. An interesting use case for that is to package bpmn-moddle with Pyolite kernel in JupyterLite Camunda Cockpit plugin. That makes a bit easier to parse features from BPMN XML when interactively highlighting items on BPMN.

Possibly a more practical new feature in JupyterLite (mostly inherited from the main JupyterLab project) is the builtin collaboration support, based on WebRTC: when two users are browsing a notebook with the same name, they can collaborate on it in real time. That does still have some issues and is missing UI for turning it on and off, but pretty interesting development anyway.

2 Likes

Do you maybe have an example for I make an analysis on my camunda data from within the JupyterLite plugin? I guess I would have to connect to rest endpoints or better connect to database directly?

Yes, the data must be fetched from REST API. The plug-in comes with an example, but I did some mistakes there (the old example uses json.loads to transform json to Python when pyodide’s to_py() should be used instead), and should update it (maybe later today). It must use cockpit API endpoints to use Camunda Cockpit session cookie. The endpoint is used on examples and is passed as environment variable (in os.environ) for the kernel. Beyond that the analysis is really only about knowing pandas.

Sorry for the delay. Making public examples is easier said than done. Wanted to make the example generic, demonstrate widgets, etc… and then there are many ways to bind interactive widgets to code and I was not sure is more or less magic better. Anyway. I updated the bundled Plotly example. In future, smaller one topic examples would probably be nicer…

Unfortunately, it is not yet possible to save a notebook files with static plotly graphs from JupyterLite, but here are some screenshots from executed notebook version:s

It fetches process definitions and allows to choose a version, which is then rendered:

It demonstrates date picker widgets for choosing the period and tasks to include for the most basic descriptive statistics:

(And I only know found out that for many cases slider might be much simpler way to get choose a period between known min and max.)

Box graphs display the same descriptive statistics visually. In a live notebook these graphs are somewhat interactive and show the actual values while hovering the graph. (In this diagram durations have “normalized start time” because Plotly does not yet properly support “timedelta values” on y axis.)

Finally, I added example of timeline graph, which is useless with a lot of data, but gives a nice visualization with a few selected processes: