Long completion phase in multi instance call activity

Hi,

I’m seeing a situation where I have a multi instance call activity that calls a sub-process 500 times (iterating over a collection as input). The sub-process executes fine pretty quickly. So far everything is good.

Then, the parent process takes about 2 or 3 minutes to finish running.

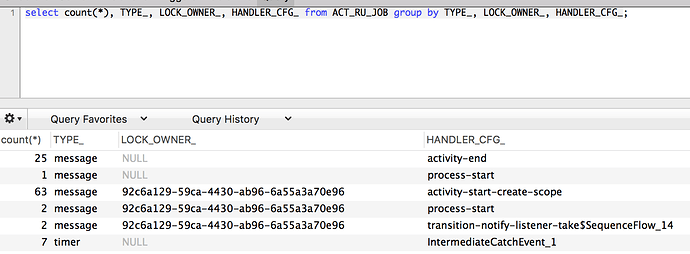
If I look at the ACT_RU_JOB table, I see one to three (but no more than three) rows that have an LOCK_OWNER_ set. If I keep requerying this table, I see the number of rows jump around (1, 2, or 3 rows). It appears to be iterating over and finishing up all 500 sub processes, but only up to three at a time. The TYPE_ column says “message”, and it appears to be ending each of the multi instance sub-processes. It appears to be setting variables like “nrOfCompletedInstances” as it progresses.

It doesn’t appear to be a bottleneck in the database, because I don’t see any long-running updates/queries. Something just seems to be taking a long time in the “cleanup” phase of the multi instance call activity.

Do you have any ideas what might be happening, and what I can do?

Thanks!
Galen

Hi Galen,

Hard to be precise based on your description, however some concepts to be aware of;

Is your multi-instance call paralle or serial? I suspect parallel. If that the case, the engine probably creates 500 async jobs in the job table. The job executor may be locking 3 at a time which is why you may see three jobs locked at a time.

Can you expand on what you mean by the cleanup phase takes 2-3 mins?

regards

Rob

Hi Rob,

Yes, the multi-instance call is parallel. Here’s what it looks like:

In cockpit, I see the 100 (I changed it to 100 to make my test run faster) subprocesses are running for a few seconds, then they all finish.
Then I only see the single (parent) process shown above running in the cockpit. Even though all of the sub processes are done running, the parent process stays on the multi-instance call for 2-3 mins. During this time, if I look at the database, I see groups of 1, 2, or 3 jobs that are locked (have LOCK_OWNER_ set to an ID).

At this point in time, I see the number 100 in the cockpit like this:


Then, yes, I do see what appears to be groups of 1-3 being worked on:

You can see from this screenshot that 2 are currently locked, while 70 are still waiting. At this point in the screenshot, there is about 30 seconds left… It seems to me like updating the records for the 100 sub-processes, should only take a few seconds. It seems to be taking almost one whole second per locked row to complete.

It should be noted that while these sub-processes are being spun up, this also seems to happen in groups of 1-3 (the “proces-start” rows):

My job executors are set to have 16 threads, and in my tests, I only have two active nodes (job executors).

Furthermore, I have not changed the default queueSize parameter of 3, but there appear to be 67 rows that are locked in this example. I’m probably not understanding the queueSize here. It seems like the activity-start-create-scope rows aren’t limited by the queueSize.

If I increase the “maxJobsPerAcquisition” parameter to 10, I see groups of 10 being worked on.
Then one second later 9, then one second later 8, and so on…
When it gets down to zero, it jumps back up to 10 again.

I hope this makes more sense now.

NOTE: I’m on Tomcat, and using Camunda 7.7.0

Thanks,
Galen

Hi Galen,

You could set the following logger’s levels to FINE:

  • org.camunda.bpm.engine.cmd: Logging every command the engine performs, including job execution
  • org.camunda.bpm.engine.impl.persistence.entity.JobEntity: Logging every statement made to the ACT_RU_JOB table
  • org.camunda.bpm.engine.jobexecutor: Logs results and timing of job acquisition

This should provide some understanding of what is going on.

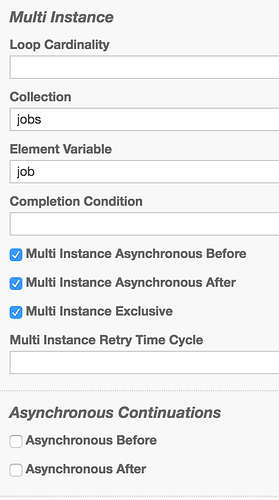
By the way, are the jobs configured to be exclusive? If yes, then effectively only one thread processes all those jobs sequentially. 3 minutes for 500 jobs/transactions still appears too long, though.

Cheers,
Thorben

Hi Thorben,

When you are asking about jobs being exclusive, are you asking about the “Multi Instance Exclusive” checkbox? Here are my settings on the multi-instance call activity:

Thanks,
Galen

Hi Galen,

Yes, that is what I mean. Does the subprocess itself have any wait states like asynchronous continuations or receive tasks, etc?

Cheers,
Thorben

Hi Thorben,

Yes, there is an asynchronous before on the start event. There is also a timer task in the subprocess.
Those are the two tasks that have asynchronous continuations.

In recent tests, the final phase seems to be much quicker. Instead of 2-3 minutes, it takes about 20 seconds.

I think there may have been some weird network or database issues before, but it’s hard for me to say now.

I guess in conclusion, the fact that a single thread handles all of the setting of the variables at the end, is probably causes it to take a bit of time. I had to select the exclusive flag, because without that, I was getting a lot of optimistic locking exceptions, and it made the performance even worse.

Thanks for you help, and next time I see slow performance, I’ll try to do a better job of catching it in the act, and determining what the bottleneck is (database, network, code, etc…).

Thanks,
Galen