I set up the zeebe cluster using the zeebe cluster helm chart.
And deploy a additional prometheus, grafana.
the service name of zeebe broker is t1-zeebe-zeebe.
Below is the prometheus configuration to get metrics from the zeebe broker.
- job_name: zeebe
scrape_interval: 6s
metrics_path: /metrics
scheme: http
static_configs:- targets: [‘t1-zeebe-zeebe-0.t1-zeebe-zeebe:9600’,‘t1-zeebe-zeebe-1.t1-zeebe-zeebe:9600’]
And below is the promethus screen when I search for the workflow instance count.
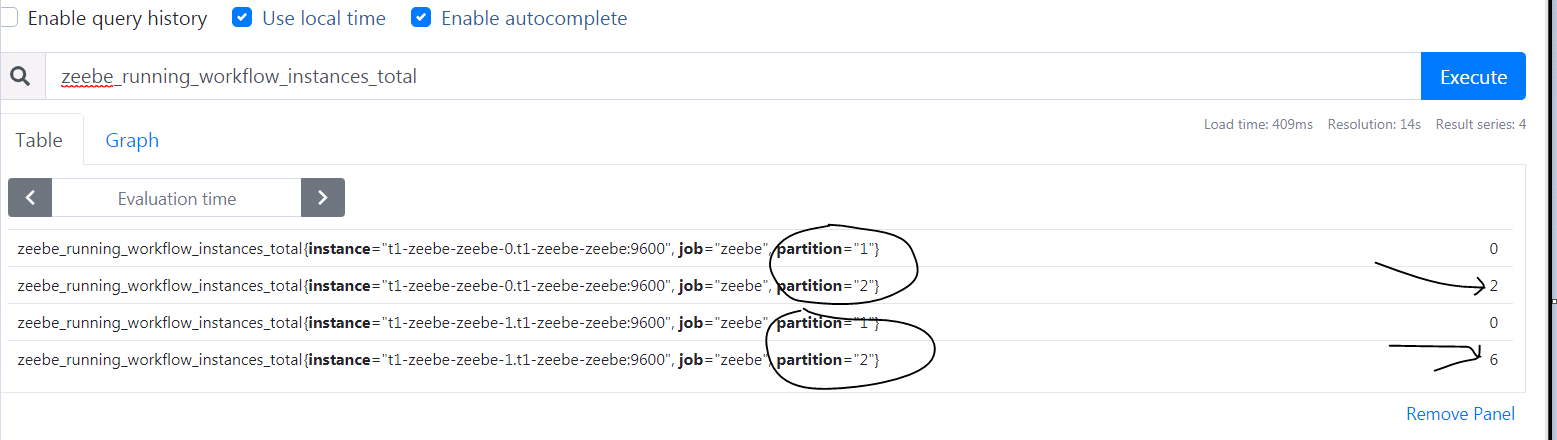
You can see that the broker t1-zeebe-zeebe-0 and t1-zeebe-zeebe-1 both have partion1, partion2.
but from my understanding, one leader like partition1 or partition2.can only exist in one broker.
Below is the status of cluster. The partition 1 leader and partition2 leader are both in the broker 0.
Cluster size: 2
Partitions count: 2
Replication factor: 2
Gateway version: 0.24.2
Brokers:
Broker 0 - t1-zeebe-zeebe-0.t1-zeebe-zeebe.default.svc.cluster.local:26501
Version: 0.24.2
Partition 1 : Leader
Partition 2 : Leader
Broker 1 - t1-zeebe-zeebe-1.t1-zeebe-zeebe.default.svc.cluster.local:26501
Version: 0.24.2
Partition 1 : Follower
Partition 2 : Follower
And I also checked the camunda operator that this moment there are only 6 workflow instance.
I downloaded the grafana dashboard from zeebe website, that it will show up 8 workflow instance since it will use the grammar sum(zeebe_running_workflow_instances_total{namespace=~"$namespace",partition=~"$partition",pod=~"$pod"}) to aggregate all the number.
.
So where did I make the mistake? Could any give any tips? Thanks very much.