We are running zeebe 8.5 through kubernetes in our testing environment. We are observing an issue where there are no execution details in elasticsearch for certain process executions. We are not able to find a pattern for such processes to see why the details are missing. It seems to happen randomly for any workflows. Process executions after such missing process instance ids are found too. Note the process instances that I am trying to look for executed some days back. I am not looking for real time execution records.
The below elasticsearch query doesn’t return any documents - Note the bpmn process id and the process instance key are specified.
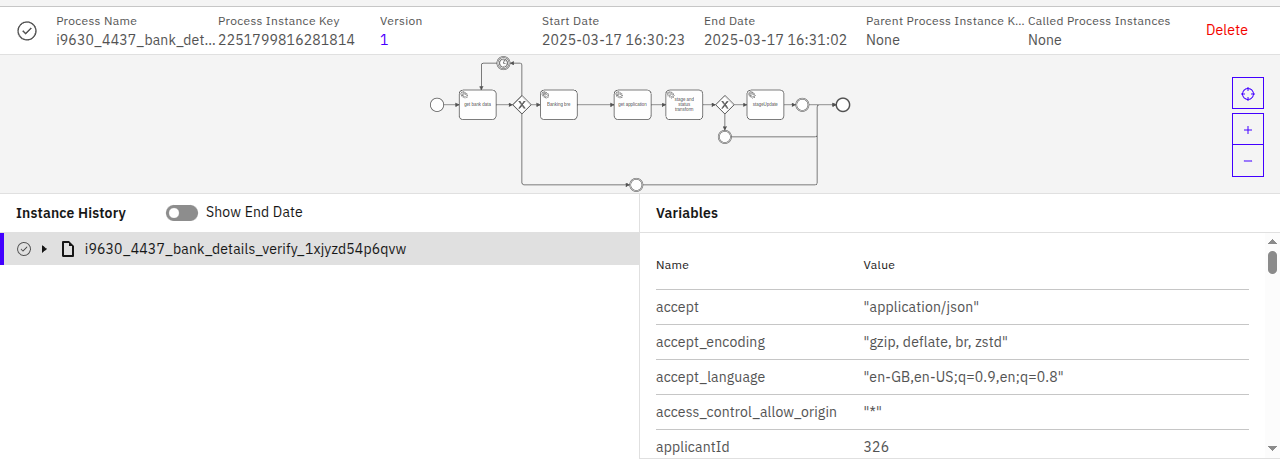
Operate does show some details like the start and end times, variables but it also doesn’t give the element start and end times as shown in the screenshot below
Can someone guide on how could we troubleshoot and find details for such process instance executions?
Thanks
Operate screenshot
Elasticsearch query -
{
  "query": {
    "bool": {
      "must": [
        { "term": { "value.bpmnProcessId": "i9630_4437_bank_details_verify_1xjyzd54p6qvw" }},
        { "term": { "value.processInstanceKey": "2251799816281814" }}
      ]
    }
  },
  "size": 10,
  "sort": [
    { "timestamp": { "order": "desc" } }
  ],
  "track_total_hits": true,
  "_source": [
    "value.processInstanceKey",
    "timestamp",
    "value.bpmnProcessId",
    "intent"
  ]
}