If i use api i can able to get data and i can find data in ES Index
io.camunda.operate.webapp.InternalAPIErrorController - Could not find process with key ‘2251799813686566’.
io.camunda.operate.store.NotFoundException: Could not find process with key ‘2251799813686566’.
at io.camunda.operate.store.elasticsearch.ElasticsearchProcessStore.getProcessByKey(ElasticsearchProcessStore.java:198) ~[operate-schema-8.6.7.jar:8.6.7]
at io.camunda.operate.webapp.reader.ProcessReader.getProcess(ProcessReader.java:56) ~[operate-webapp-8.6.7.jar:8.6.7]
at io.camunda.operate.webapp.rest.ProcessRestService.getProcessDiagram(ProcessRestService.java:51) ~[operate-webapp-8.6.7.jar:8.6.7]
at java.base/jdk.internal.reflect.DirectMethodHandleAccessor.invoke(DirectMethodHandleAccessor.java:103) ~[?:?]
at java.base/java.lang.reflect.Method.invoke(Method.java:580) ~[?:?]
at org.springframework.aop.support.AopUtils.invokeJoinpointUsingReflection(AopUtils.java:355) ~[spring-aop-6.1.14.jar:6.1.14]
at org.springframework.aop.framework.CglibAopProxy$DynamicAdvisedInterceptor.intercept(CglibAopProxy.java:716) ~[spring-aop-6.1.14.jar:6.1.14]
at io.camunda.operate.webapp.rest.ProcessRestService$$SpringCGLIB$$0.getProcessDiagram() ~[operate-webapp-8.6.7.jar:8.6.7]
at java.base/jdk.internal.reflect.DirectMethodHandleAccessor.invoke(DirectMethodHandleAccessor.java:103) ~[?:?]
at java.base/java.lang.reflect.Method.invoke(Method.jav
Hi @sree.s - can you share the API response and what you’re seeing in Elastic?
We have exactly the same problem. I’ve enabled elasticsearch debug log and can see the following behaviour. We are using Camunda 8.6.5 with Enterprice license:
org.elasticsearch.client.RestClient - request [POST http://dsp-svc-camunda-elasticsearch:9200/operate-flownode-instance-8.3.1_alias/_search?typed_keys=true&max_concurrent_shard_requests=5&search_type=query_then_fetch&batched_reduce_size=512] returned [HTTP/1.1 200 OK]

2025-03-22 22:05:29.065 [] [http-nio-0.0.0.0-8080-exec-7] [] WARN io.camunda.operate.webapp.InternalAPIErrorController - Could not find process with key '2251799813689000'. io.camunda.operate.store.NotFoundException: Could not find process with key '2251799813689000'. at
io.camunda.operate.store.elasticsearch.ElasticsearchProcessStore.getProcessByKey(ElasticsearchProcessStore.java:198) ~[operate-schema-8.6.5.jar:8.6.5]
So the problem seems to happen here:
Looking at how the index name is composed in the following locations:
I assume that index name is operate-process-8.3.0_alias and it is this query that does not find the process with the given key:
[POST http://dsp-svc-camunda-elasticsearch:9200/operate-process-8.3.0_alias/_search?typed_keys=true&max_concurrent_shard_requests=5&search_type=query_then_fetch&batched_reduce_size=512] returned [HTTP/1.1 200 OK]
@martin_schaefer - how quickly after the process is started are you running this query? There is a delay due to the exporter, and I’m wondering if that might be the cause (or making things harder to troubleshoot). Does it happen with every process, or only some? Once that one process key isn’t found, does it ever start working correctly later (for instance, if you try to query it the next day)?
@nathan.loding this is for every process instance the data is gettgin reflected in zeebe* indices for not in operate or tasklist
@sree.s - is this still with 8.6.7, or have you upgraded since? How did you deploy it? Can you share your configuration (docker-compose, or values.yaml, etc)?
I also have the other unanswered questions:
- how quickly after the process is started are you running this query? There is a delay due to the exporter, and I’m wondering if that might be the cause (or making things harder to troubleshoot).
- Does it happen with every process, or only some? Once that one process key isn’t found, does it ever start working correctly later (for instance, if you try to query it the next day)?
@nathan.loding i dint get any chance to work with other versions but once i restart zeebe sometimes its not getting reflected in operate indices its only getting reflected once i clear all the old data deploying it in docker compose for dev purpose
@sree.s - this is still missing a lot of critical information in order to help further.
- Can you share your configuration (docker-compose.yaml)?
- How quickly after the process is started are you running this query?
- Once that one process key isn’t found, does it ever start working correctly later (for instance, if you try to query it the next day)?
- My docker compose
While the Docker images themselves are supported for production usage,
services:

  zeebe: # https://docs.camunda.io/docs/self-managed/platform-deployment/docker/#zeebe
    image: camunda/zeebe:${CAMUNDA_ZEEBE_VERSION}
    container_name: zeebe
    ports:
      - "26500:26500"
      - "9600:9600"
      - "8088:8080"
    environment: # https://docs.camunda.io/docs/self-managed/zeebe-deployment/configuration/environment-variables/
      - ZEEBE_BROKER_EXPORTERS_ELASTICSEARCH_CLASSNAME=io.camunda.zeebe.exporter.ElasticsearchExporter
      - ZEEBE_BROKER_EXPORTERS_ELASTICSEARCH_ARGS_URL=http://elasticsearch:9200
      # default is 1000, see here: https://github.com/camunda/zeebe/blob/main/exporters/elasticsearch-exporter/src/main/java/io/camunda/zeebe/exporter/ElasticsearchExporterConfiguration.java#L259
      - ZEEBE_BROKER_EXPORTERS_ELASTICSEARCH_ARGS_BULK_SIZE=1
      # allow running with low disk space
      - ZEEBE_BROKER_DATA_DISKUSAGECOMMANDWATERMARK=0.998
      - ZEEBE_BROKER_DATA_DISKUSAGEREPLICATIONWATERMARK=0.999
      - CAMUNDA_DATABASE_URL=http://elasticsearch:9200
      - "JAVA_TOOL_OPTIONS=-Xms512m -Xmx512m"
    restart: unless-stopped
    healthcheck:
      test: [ "CMD-SHELL", "timeout 10s bash -c ':> /dev/tcp/127.0.0.1/9600' || exit 1" ]
      interval: 30s
      timeout: 5s
      retries: 5
      start_period: 30s
    volumes:
      - zeebe:/usr/local/zeebe/data
    networks:
      - camunda-platform
    depends_on:
      - elasticsearch

  operate: # https://docs.camunda.io/docs/self-managed/platform-deployment/docker/#operate
    image: camunda/operate:${CAMUNDA_OPERATE_VERSION}
    container_name: operate
    ports:
      - "8081:8080"
    environment: # https://docs.camunda.io/docs/self-managed/operate-deployment/configuration/
      - CAMUNDA_OPERATE_ZEEBE_GATEWAYADDRESS=zeebe:26500
      - CAMUNDA_OPERATE_ELASTICSEARCH_URL=http://elasticsearch:9200
      - CAMUNDA_OPERATE_ZEEBEELASTICSEARCH_URL=http://elasticsearch:9200
      - CAMUNDA_OPERATE_CSRFPREVENTIONENABLED=false
      - CAMUNDA_DATABASE_URL=http://elasticsearch:9200
      - management.endpoints.web.exposure.include=health
      - management.endpoint.health.probes.enabled=true
    healthcheck:
      test: [ "CMD-SHELL", "wget -O - -q 'http://localhost:9600/actuator/health/readiness'" ]
      interval: 30s
      timeout: 1s
      retries: 5
      start_period: 30s
    networks:
      - camunda-platform
    depends_on:
      - zeebe
      - elasticsearch

  tasklist: # https://docs.camunda.io/docs/self-managed/platform-deployment/docker/#tasklist
    image: camunda/tasklist:${CAMUNDA_TASKLIST_VERSION}
    container_name: tasklist
    ports:
      - "8082:8080"
    environment: # https://docs.camunda.io/docs/self-managed/tasklist-deployment/configuration/
      - CAMUNDA_TASKLIST_ZEEBE_GATEWAYADDRESS=zeebe:26500
      - CAMUNDA_TASKLIST_ZEEBE_RESTADDRESS=http://zeebe:8080
      - CAMUNDA_TASKLIST_ELASTICSEARCH_URL=http://elasticsearch:9200
      - CAMUNDA_TASKLIST_ZEEBEELASTICSEARCH_URL=http://elasticsearch:9200
      - CAMUNDA_TASKLIST_CSRFPREVENTIONENABLED=false
      - CAMUNDA_DATABASE_URL=http://elasticsearch:9200
      - management.endpoints.web.exposure.include=health
      - management.endpoint.health.probes.enabled=true
    healthcheck:
      test: [ "CMD-SHELL", "wget -O - -q 'http://localhost:9600/actuator/health/readiness'" ]
      interval: 30s
      timeout: 1s
      retries: 5
      start_period: 30s
    networks:
      - camunda-platform
    depends_on:
      - zeebe
      - elasticsearch

  connectors: # https://docs.camunda.io/docs/components/integration-framework/connectors/out-of-the-box-connectors/available-connectors-overview/
    image: camunda/connectors-bundle:${CAMUNDA_CONNECTORS_VERSION}
    container_name: connectors
    ports:
      - "8085:8080"
    environment:
      - CAMUNDA_CLIENT_MODE=self-managed
      - CAMUNDA_CLIENT_ZEEBE_GRPCADDRESS=http://zeebe:26500
      - OPERATE_CLIENT_BASEURL=http://operate:8080
      - OPERATE_CLIENT_PROFILE=simple
      - management.endpoints.web.exposure.include=health
      - management.endpoint.health.probes.enabled=true
    healthcheck:
      test: [ "CMD-SHELL", "curl -f http://localhost:8080/actuator/health/readiness" ]
      interval: 30s
      timeout: 1s
      retries: 5
      start_period: 30s
    env_file: connector-secrets.txt
    networks:
      - camunda-platform
    depends_on:
      - zeebe
      - operate

  elasticsearch: # https://hub.docker.com/_/elasticsearch
    image: docker.elastic.co/elasticsearch/elasticsearch:${ELASTIC_VERSION}
    container_name: elasticsearch
    ports:
      - "9200:9200"
      - "9300:9300"
    environment:
      - bootstrap.memory_lock=true
      - discovery.type=single-node
      - xpack.security.enabled=false
      # allow running with low disk space
      - cluster.routing.allocation.disk.threshold_enabled=false
      - "ES_JAVA_OPTS=-Xms512m -Xmx512m"
    ulimits:
      memlock:
        soft: -1
        hard: -1
    restart: unless-stopped
    healthcheck:
      test: [ "CMD-SHELL", "curl -f http://localhost:9200/_cat/health | grep -q green" ]
      interval: 30s
      timeout: 5s
      retries: 3
    volumes:
      - elastic:/usr/share/elasticsearch/data
    networks:
      - camunda-platform

volumes:
  zeebe:
  elastic:

networks:
  camunda-platform:
- I check after sometime
- I didnt check next day i mostly clear all the data in elastic and try
my zeebe version is 8.6.6
Hi @sree.s - that is our default docker-compose-core.yaml configuration. I did a quick test in my Docker environment and everything seems to process normally.
There are some conflicting answers in this thread. At one point, you say that every process is missing, then at another you say it’s only some, then at another you say that it works if you delete data. Unfortunately I don’t have enough information to help much further.
Internally, Zeebe exports records through the exporter into Elasticsearch. Operate has an importer that runs and consumes the exported data and adds it to the Operate indices. (This process typically only takes a few seconds, but for troubleshooting you may want to give it 2-3 minutes to be sure. This architecture is also changing with the 8.8 release.)
If the data isn’t appearing, I would try restarting the Operate container and see if it starts to pick up the data. If it still doesn’t, I would try to stop Operate and Zeebe, start Zeebe, then start Operate, and check again. If it’s still not working, then I would begin reviewing logs to look for issues - I would start with Elasticsearch logs, then Operate, then Zeebe. I would also look into increasing the available resources (CPU, disk, RAM) to ensure there are no bottlenecks. Because you mentioned deleting data seems to get things flowing again, that makes me suspect a possible resource bottleneck, perhaps with disk space?
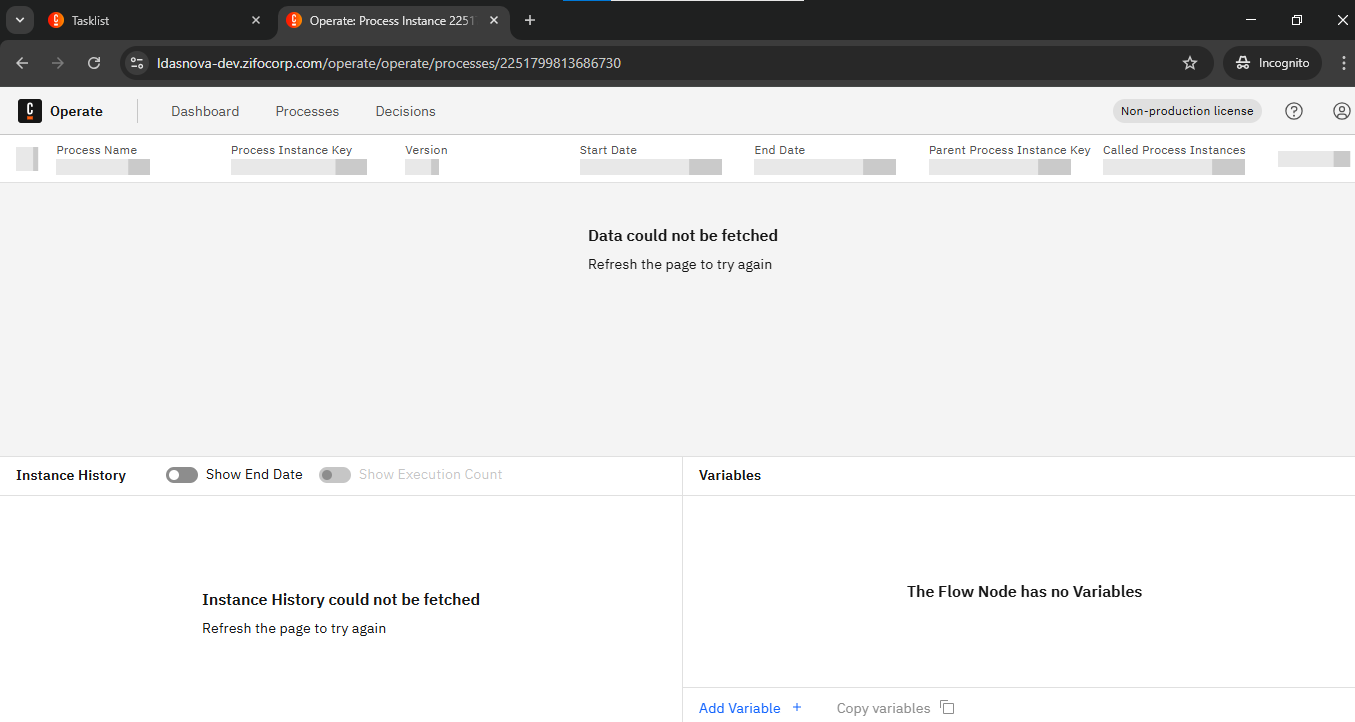
@nathan.loding Thanks for the response. I recently encountered an issue during deployment. After deploying, I received the deployment key and was able to launch the process and view its status in the Operate list. However, when I checked the Operate details page, the XML details were missing. Upon investigation, I noticed that there was no BPMN XML associated with the model. Interestingly, after launching a new version later on, the issue no longer occurred. I found this behavior quite strange