I have been experiencing a recurring issue in Camunda and would like to know if anyone has faced a similar situation or can provide guidance on how to resolve it.
During certain operations — such as moving an instance, canceling a process, or attempting to delete a process after it has been canceled — the system gets stuck.
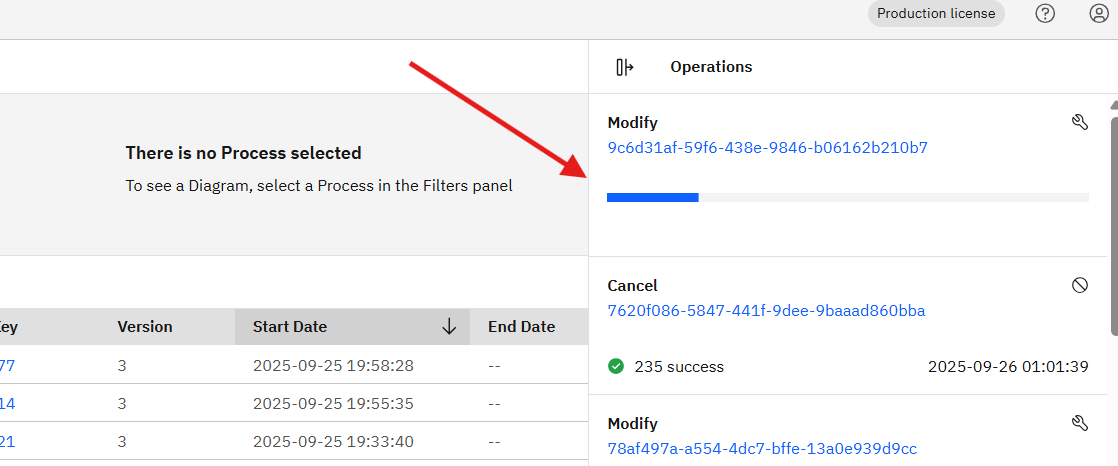
On the interface, the blue progress bar reaches the end but never completes the operation. When I refresh the page, the loading starts again, but the issue persists, and the action is never finalized.
From what I can observe, it seems that some background processing does not finish, and over time this begins to affect even new instances.
So far, the only way I have found to permanently resolve the issue is by clearing all volumes, including those from Elasticsearch. However, this also removes the entire process history, which is not a viable solution.
Has anyone encountered this problem before? Do you know why it happens and whether there is a proper way to fix it without losing historical data?
I can see you’re experiencing a frustrating issue with operations getting stuck in Camunda Operate. This is actually a known problem that typically occurs due to synchronization issues between Zeebe, Operate, and Elasticsearch.
Classification: This is a Problem - operations are not behaving as expected.
Based on your description, this appears to be caused by one or more of the following:
Most Common Causes:
Elasticsearch Index/Shard Issues - Missing or corrupted indices (like operate-process-*) can cause operations to hang indefinitely
Data Inconsistency - Process instances may exist in Elasticsearch but not in Zeebe, causing operations to fail silently
Importer/Exporter Pipeline Problems - The synchronization between Zeebe and Elasticsearch may be disrupted
Resource Bottlenecks - Low disk space, memory, or CPU can stall the import/export pipeline
Troubleshooting Steps (Without Losing Data):
Before we proceed with more specific solutions, I need some additional information:
What version of Camunda 8 are you using? (format: major.minor.patch)
Are you running SaaS or Self-Managed?
What’s your deployment setup? (Docker, Kubernetes, etc.)
Immediate Actions You Can Try:
Check Elasticsearch Health:
Verify all required indices exist and are healthy
Look for shard allocation issues
Check disk space and resource usage
Review Logs:
Check Zeebe, Operate, and Elasticsearch logs for errors around the time operations get stuck
Look for import/export errors or timeouts
Restart Services (Ordered):
Restart Operate first, then Zeebe
This can help resynchronize the state without data loss
Resource Check:
Ensure adequate disk space, memory, and CPU for all components
Could you please provide the version and environment details so I can give you more targeted assistance? Also, if you can share any relevant log entries from when the operations get stuck, that would be very helpful!
Perfect! Thank you for the details. With Camunda 8.7.12 Self-Managed on Docker, this issue is quite common and there are specific troubleshooting steps we can take without losing your historical data.
Immediate Diagnostic Steps:
1. Check Elasticsearch Health
Run these commands to check your Elasticsearch status:
# Check cluster health
curl -X GET "http://localhost:9200/_cluster/health?pretty"

# List all indices to ensure required ones exist
curl -X GET "http://localhost:9200/_cat/indices?v"
Look for:
Cluster status should be green or yellow (not red)
Required indices like operate-*, zeebe-* should be present
Exception occurred when performing post import for partition
Process instance is not yet imported for incident processing
Elasticsearch exception [type=search_phase_execution_exception, reason=all shards failed]
In Zeebe logs:
Failed to export record
Elasticsearch exporter error
# Check disk space
df -h

# Check container resource usage
docker stats
Ensure you have:
At least 10% free disk space
Sufficient memory for Elasticsearch (recommended: 4GB+)
Advanced Troubleshooting:
If the basic steps don’t work, we can:
Check specific indices integrity
Verify Zeebe-Elasticsearch synchronization
Look for specific data inconsistencies
Questions for Better Diagnosis:
When did this issue first start occurring? (After an update, restart, or specific operation?)
Are you seeing any specific error messages in the UI or logs?
How much disk space is available on your system?
What’s your Docker Compose configuration? (especially Elasticsearch memory settings)
Could you run the health check commands above and share the results? Also, if you can share any relevant log entries from when operations get stuck, that would help pinpoint the exact cause.
This approach should help us identify and fix the root cause without losing your process history!