Parallel multi-instance slow and resource intensive

I have the following simple process:

I also tried to make sure that all variables stored inside the expanded sub-process are properly scoped (or even transient where possible).

However, when running this with 10k book IDs, the engine (using the Run Docker image and PostgreSQL DB) goes from ~1GiB very close to my limit of 2 GiB.

In addition, the process of creating all jobs takes quite some time and although I did my best to avoid any collisions on variables, I still see plenty of OptimisticLockingExceptions being thrown around.

The overall performance is ~4-5x slower in parallel mode than in sequential mode while using much more resources (CPU, memory, DB load, …).

Is there some more detail on why this is the case and what I can do to improve the situation?

What are the engine settings?
Have you changed anything on the job acquisition or job executor settings?

@Niall These are my settings:

camunda.bpm:
  enabled: true
  history-level: AUDIT
  default-number-of-retries: 5
  job-executor-acquire-by-priority: true

# https://docs.camunda.org/manual/latest/user-guide/security/#http-header-security-in-webapps
# https://docs.camunda.org/manual/latest/webapps/shared-options/header-security/
  webapp:
    csrf:
      enable-same-site-cookie: true
      same-site-cookie-option: STRICT
    header-security:
      hsts-disabled: false

# https://docs.camunda.org/manual/latest/user-guide/security/#authorization
# https://docs.camunda.org/manual/latest/user-guide/process-engine/authorization-service/
  authorization:
    enabled: false
    tenant-check-enabled: false

  generic-properties.properties:
# https://docs.camunda.org/manual/latest/user-guide/security/#variable-values-from-untrusted-sources
    deserialization-type-validation-enabled: true
    deserialization-allowed-packages:
    deserialization-allowed-classes:
# https://docs.camunda.org/manual/latest/user-guide/security/#password-policy
# https://docs.camunda.org/manual/latest/user-guide/process-engine/password-policy/
    enable-password-policy: true

    cmmn-enabled: true
    failed-job-retry-time-cycle: "PT3S,PT7S"
    hint-job-executor: true
    history-cleanup-batch-window-start-time: "02:00Z"
    history-cleanup-batch-window-end-time: "04:00Z"
    history-cleanup-strategy: "removalTimeBased"
    history-time-to-live: "P90D"
    history-cleanup-job-log-time-to-live: "P14D"
    initialize-telemetry: false
    telemetry-reporter-activate: false
    job-executor-acquire-by-due-date: true
    job-executor-prefer-timer-jobs: true
    standalone-tasks-enabled: false
    tenant-check-enabled: false

  run:
# https://docs.camunda.org/manual/latest/user-guide/security/#authentication
# https://docs.camunda.org/manual/latest/user-guide/camunda-bpm-run/#authentication
    auth.enabled: false

  metrics:
    enabled: true
    db-reporter-activate: true

  database:
    schema-update: true
    jdbc-batch-processing: true

  eventing:
    execution: true
    history: true
    task: true

  job-execution:
    enabled: true
    deployment-aware: false
    core-pool-size: 3
    max-pool-size: 10
    keep-alive-seconds: 30
    max-jobs-per-acquisition: 30
    queue-capacity: 50
    lock-time-in-millis: 300000
    wait-time-in-millis: 250
    wait-increase-factor: 1.5
    max-wait: 15000
    backoff-time-in-millis: 500
    max-backoff: 30000
    backoff-decrease-threshold: 10

Are you using a clustered setup or a single engine?

That’s a single engine, locally running in a Docker Compose setup (incl. PostgreSQL).

This is the main part of the compose setup (have other services there as well, but they don’t interfere):

services:
  database:
    image: "bitnami/postgresql:14.6.0"
    deploy:
      resources:
        limits:
          cpus: "2.0"
          memory: "1G"
        reservations:
          cpus: "2.0"
          memory: "1G"
    environment:
      BITNAMI_DEBUG: "true"
      POSTGRESQL_POSTGRES_PASSWORD: "admin-pass"
      POSTGRESQL_USERNAME: "camunda-bpm"
      POSTGRESQL_PASSWORD: "camunda-pass"
      POSTGRESQL_DATABASE: "camunda-bpm"
      POSTGRESQL_INITSCRIPTS_USERNAME: "postgres"
      POSTGRESQL_INITSCRIPTS_PASSWORD: "admin-pass"
      POSTGRESQL_LOG_CONNECTIONS: "on"
      POSTGRESQL_LOG_DISCONNECTIONS: "on"
      POSTGRESQL_STATEMENT_TIMEOUT: "30s"
      POSTGRESQL_PGAUDIT_LOG: "misc"
      POSTGRESQL_SHARED_PRELOAD_LIBRARIES: "pgaudit, pg_stat_statements"
      POSTGRESQL_EXTRA_FLAGS: "-c work_mem=16MB -c maintenance_work_mem=64MB -c pg_stat_statements.track=top -c track_io_timing=on -c track_functions=all -c effective_cache_size=768MB"
    restart: unless-stopped
    networks:
      - camunda-net
    volumes:
      - camunda-data:/bitnami/postgresql
      - ./docker/initdb.d:/docker-entrypoint-initdb.d:ro
    tmpfs:
      - /run
      - /var/run
      - /tmp

  camunda-bpm:
    image: "enote/camunda-bpm-run:local"
    container_name: camunda-bpm
    deploy:
      resources:
        limits:
          cpus: "2.0"
          memory: "2G"
        reservations:
          cpus: "0.1"
          memory: "1G"
    environment:
      CONFIG_APP: "/etc/enote/camunda/application.yml"
    restart: unless-stopped
    networks:
      camunda-net:
    links:
      - database
    ports:
      - "8080:8080"
    volumes:
      - ./camunda.yml:/etc/enote/camunda/application.yml:ro
    tmpfs:
      - /run
      - /var/run
      - /tmp

So, with all of the transaction boundaries created with the asynchronous tick boxes, its going to create a LOT of jobs when 10k instances are created. It’s also on the same process instance so this means that only one thread can act on the process at a time because the exclusive tick box is set to true.

It might get better performance is you don’t don’t an async tick on the Fetch book details and rather add one to the start event that the Process Book call activity is calling.

1 Like

OK, after doing lots of experiments, I’ve been switching to converting the expanded sub-process into its own and using another Call Activity.

This finally seems to have addressed the memory pressure issue to a big degree, but even now that there are no variables being shared (a book_id is the only input variable to the Call Activity - no output mapping), execution is super slow (although using all CPU granted) and it barely makes progress, throwing thousands of OptimisitcLockingExceptions. I guess those can only be related to the internal variable nrOfCompletedInstances aso. which I thought was mainly fixed since 7.3. At least this article sounded like that: Why we Re-Implemented BPMN Multi-Instance Support in 7.3 | Camunda

I am currently on 7.18

So I guess I still have to stick with sequential execution then.

Btw. how is the situation with Camunda 8 in this case?

I have strict resource constraints (not more than 2 GiB memory for the whole BPMN/DMN runtime, all components included (excluding DB).

Actually with 10000 elements in parallel you can go out of resources.
In case of very large lists I recommend use splitting list into chunks.
For example, create array with 200 chunks with 50 book in chunk.
Run chunk as sequence, run books in chunk in parallel.
It this case you can fully control resources by testing algorithm with different size of chunk.

Optimistic locking issue is about changing variables. It is about joining parallel threads. I recommend setup async before flag on end event of your subprocess Process book.

1 Like

Hello @enote-kane ,

also Camunda 8 has a problem with big multi-instances.

I would also recommend what @MaximMonin said:

Split your list in reasonable pages, preventing your engine to become too slow while still being able to process in parallel. I would recommend a maximum of 1000 elements per page, but 2000 should also work quite well.

The paging can be done in sequential multi-instance that wraps the parallel multi-instance or with a modelled loop that has a counter.

Jonathan

@MaximMonin @jonathan.lukas Thanx for the pointer to split it up into chunks.

However, after some testing the memory pressure issue stays (even at only 100 book IDs in a chunk) the same or got even worse (I have no real numbers since the camunda-bpm-run Docker image doesn’t contain tools like jmap or similar to get a head dump to analyze).

The tip for creating a separate transaction before the end event in the parallel sub-process did not help to avoid OptimisticLockingExceptions at all. Number of occurrences stay roughly the same here.

However, after configuring GC logging into a separate file, I saw a lot of “G1 Humongous Allocation”, which indicates to me that very large objects are being allocated very often, which I couldn’t make any clue about at first.

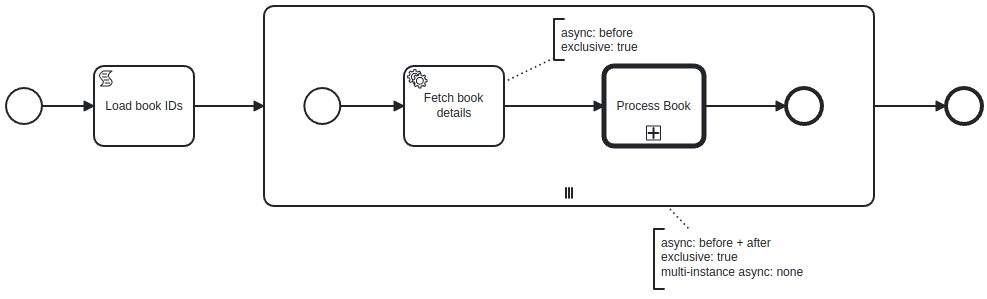
Then I thought about the loop itself and as I am not at all into the Camunda multi-instance implementation code base, I thought maybe it’s the big list of book ID’s (actually UUIDs), which I have stored as a serialized ArrayList variable.

In a new version, I integrated Redisson (using their Spring Boot Starter), offloaded the list itself and instead of using collection and elementVariable in the multi-instance, I just have my cardinality and load each book ID from Redis inside the sub-process using the loopCounter as the list index.

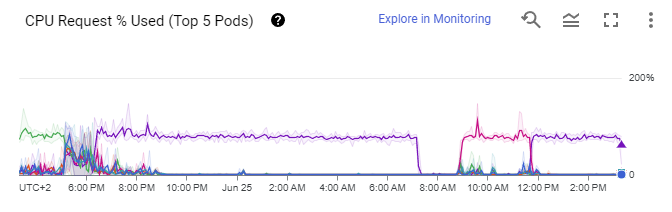
That alone brought pressure by GC down a lot. I am still running with sequential multi-instance for now, but after ~5000 iterations, there is barely any GC activity, only a normal evacuation pause every 7-8 seconds. CPU - of course - also went down a lot. The load on the PostgreSQL is now one of the bottlenecks.

Overall, performance of this approach is the fastest so far and the most consistent / predictable (sub-process executions / second).

I will re-try with parallel execution as well to see if this approach actually does anything to the OptimisticLockingExceptions, but I doubt it.

Nevertheless, I am already taking the following learnings here:

  1. Never loop over large lists (use an external fast data source to iterate over reliably)
  2. Inside a loop, restrict to absolutely necessary transaction boundaries and number of variables (if variables are necessary, remove them before the next transaction boundary/commit, so that they do not get persisted)
2 Likes

After some final testing, I’ve come to the conclusion that sequential processing is the most efficient and fastest way. Even when using Redis (or Memcached) as process data variable store, the overhead introduced due to transaction handling, job creation and handling, aso. is simply not worth the “benefit” of running things in parallel.

This may be different if the execution time within the multi-instance sub-process is more than just a few milliseconds.

Out of the last parallel experiment, I take the following learnings:

  1. even if you’re not operating on a collection in the loop, large cardinality WILL result in an OutOfMemory eventually (for me it was ~50000 for a 2GiB container with 70% heap initial+max)
  2. the overhead to manage most effective chunk size (which is highly dependent on the runtime environment - num of CPUs + speed, max heap size, DB scalability + network latency, …) is too much to start thinking about, since the same process will be deployed to different environments with different performance characteristics

I am using many parallel processing in my models and have no problems with optimistic locking. But my lists is not so large. The only case with 10000 items… I use 3 processing threads, because of api spams restrictions.

@MaximMonin In my last tests, I made it actually run with my CPU + memory limits and 10000 book IDs, however:

  1. initial parallel job creation time (even now that I don’t use a collection anymore) takes ~15 minutes
  2. CPU on Camunda and DB is ~3-4 times as high compared to sequential
  3. pressure on GC is much higher, with ~2 Evacuation pauses per second, taking usually 2-3x as much time than for sequential processing
  4. still have plenty of optimistic lock exceptions (~6 per second in average)
  5. probably 3. together with 4. causing delays in actual execution of logic, slowing things down, so much that parallel processing is actually much slower than sequential

For the record, the parallel sub-process (no chunk wrapper) was configured with

  • async cont:
    • before
    • exclusive
  • multi-instance async cont:
    • before
    • exclusive
  • start event of sub-process async cont:
    • before
    • exclusive

Without the async cont. at the start event, everything is sequential still. Same if I remove the multi-instance async cont. Weird.

Actually it is strage. I never use multi instance async before. Only async before for whole and async before on subprocess on start event to minimize creation time.

I see a similar behavior on my environment. There are lot’s of jobs to execute but only one instance is doing something.
image
You see of 10 pods running the same deployment and configuration only one is usually doing something.

I think the problem is that the PostgreSQL is returning the same 30 jobs for each instance querying and that the offset at new Page at

  public AcquiredJobs execute(CommandContext commandContext) {

    acquiredJobs = new AcquiredJobs(numJobsToAcquire);

    List<AcquirableJobEntity> jobs = commandContext
      .getJobManager()
      .findNextJobsToExecute(new Page(0, numJobsToAcquire));

    Map<String, List<String>> exclusiveJobsByProcessInstance = new HashMap<String, List<String>>();

    for (AcquirableJobEntity job : jobs) {

      lockJob(job);

      if(job.isExclusive()) {
        List<String> list = exclusiveJobsByProcessInstance.get(job.getProcessInstanceId());
        if (list == null) {
          list = new ArrayList<String>();
          exclusiveJobsByProcessInstance.put(job.getProcessInstanceId(), list);
        }
        list.add(job.getId());
      }
      else {
        acquiredJobs.addJobIdBatch(job.getId());
      }
    }

    for (List<String> jobIds : exclusiveJobsByProcessInstance.values()) {
      acquiredJobs.addJobIdBatch(jobIds);
    }

    // register an OptimisticLockingListener which is notified about jobs which cannot be acquired.
    // the listener removes them from the list of acquired jobs.
    commandContext
      .getDbEntityManager()
      .registerOptimisticLockingListener(this);


    return acquiredJobs;
  }

is always 0.

Used configuration:
camunda.bpm.job-execution.max-jobs-per-acquisition=30
camunda.bpm.job-execution.deployment-aware=true
camunda.bpm.job-executor-acquire-by-priority=true

@bmaehr My scenario did not involve multiple job executor instances.

However, it really depends on your use case. My use case was a single process instance spawning thousands of jobs (in parallel mode).

I also got the feeling that configuration of the job executor got quite complex (complicated to a certain degree) and while the documentation is pretty good, there may still be specific configurations (combinations of options) that don’t behave as one would expect them to.

But have you tried disabling “deployment-aware”? The behavior as described in the docs read like your behavior: The Job Executor | docs.camunda.org

Now, the job acquisition thread on node 1 will only pick up jobs that belong to deployments made on that node …

I am assuming here that all your pods essentially run the same Container image and configuration. So it really depends which pod was used to deploy/update the affected process last.

Thank you for your feedback.

The deployment-aware is needed because the exists an other application processing its own process.