Problem
Before launching camunda in production we did a load test in stage environment.
30-40 new processes per second were okay.
But adding more load than that resulted in increased count of “in-process” tokens (more processes started than finished at a time unit).
As we have some timers on a BPMN-diagram, that stuckness may result in timer event kicking before a correlation of a message can occur, so the process may finish prematurely, and that’s a problem.
Setup
Camunda
7.14 + spring boot 2.4.5
BPMN-diagram:
mainly consists of several receive-tasks and send-tasks, the latter with “async-before” plus a bit of gateways.
Kubernetes:
2 replicas
requests:
memory: “3Gi”
cpu: 6000m
limits:
memory: “4Gi”
cpu: 8000m
Database:
postgresql 11.5, 4 core, 8GB RAM, HDD (probably slow), pgbouncer with pool of 40 connections to camunda db.
History level:
activity
Settings:
wait-time-in-millis: 2000
max-wait: 8000
max-jobs-per-acquisition: 50
core-pool-size: 16
max-pool-size: 24
queue-capacity: 400
backoff-time-in-millis: 25
max-backoff: 400
Load testing scenario:
We have two topics in kafka (24 partitions each), one for outgoing and other for incoming messages.
A load-generator app produces “start process” messages to incoming topic at given rate (40 rps)
Camunda starts new process internally by consuming such messages and producing new messages to outgoing message topic using java-delegate.
These messages are consumed by load-generator and are immediately replied with new “reaction” message, which mimics a reaction of external service. Such message will be processed in camunda and will be correlated (by business key) to pass over receive task.
Monitoring
Looking at kubernetes dashboard, I found no shortage for memory or cpu in camunda app.
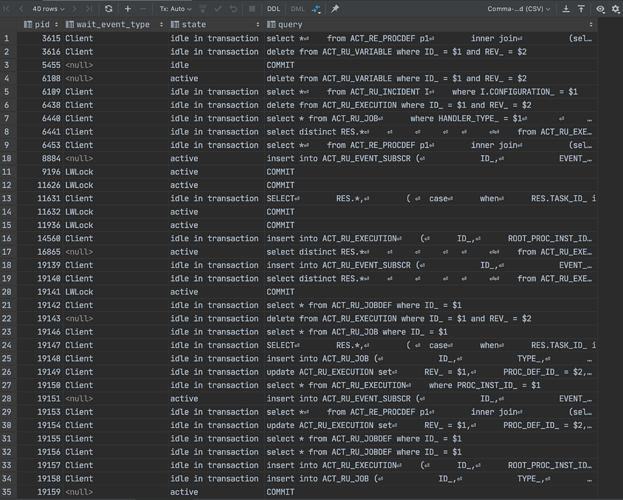
But the database thread pool was full of queries.
I suspect the database being the weakest chain in our setup, but maybe I’m missing something?
Should I try to increase the connection pool in postgres or tune something else?
Maybe database HDD is too slow?
Thanks.
