I am trying to implement JUnit Coverage for all BPMN processes using SonarQube in Spring boot and JUnit5 but not showing any graphical view of Process coverage Percentage.
org.camunda.bpm.assert
camunda-bpm-assert
15.0.0
test
org.camunda.bpm
camunda-bpm-junit5
7.21.0
test
org.camunda.bpm.extension
camunda-bpm-process-test-coverage-junit5
1.0.0
test
org.junit.jupiter
junit-jupiter
test
org.camunda.bpm.extension
camunda-bpm-process-test-coverage
0.3.2
test
First of you’re mixing old versions of the extension with a new one.
Please use only (remove the dependencies with groupId org.camunda.bpm.extension, as those are not supported anymore)
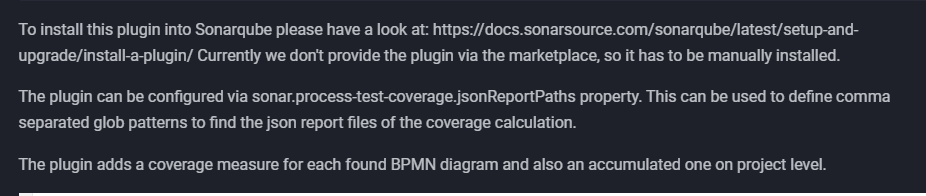
And look here for the sonar plugin (it needs to be installed into your sonarqube installation):
Afterwards you need to make sure, that your BPMN process definitions are also included in the sonar analysis (e.g. by including them in the sonar.sources property: -Dsonar.sources=src/main,pom.xml as default is not including the resources directory).
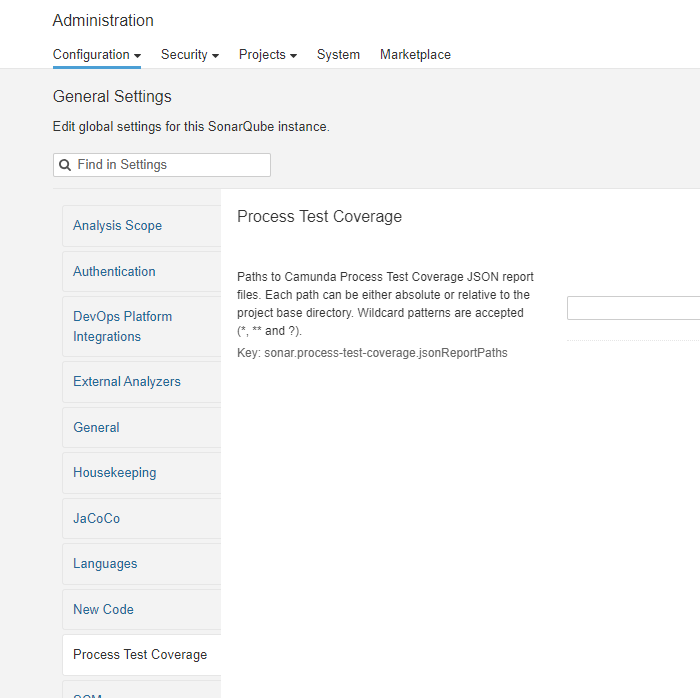
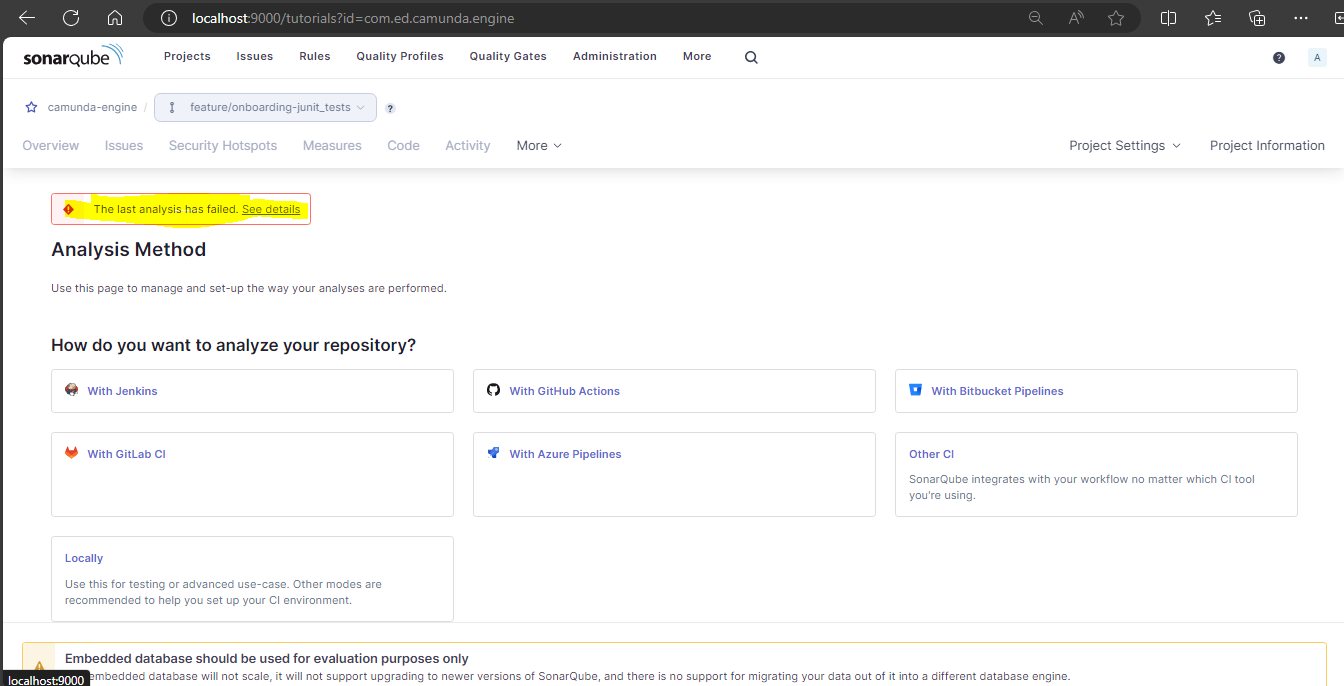
But couldn’t able to find plugin and unable get the json report of test coverage calculation suggested in attached screenshot of Sonarqube documentation.
After making changes, could not solve the issue.
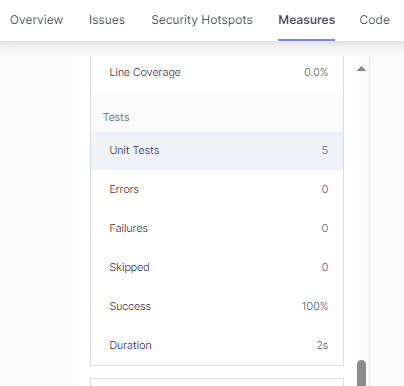
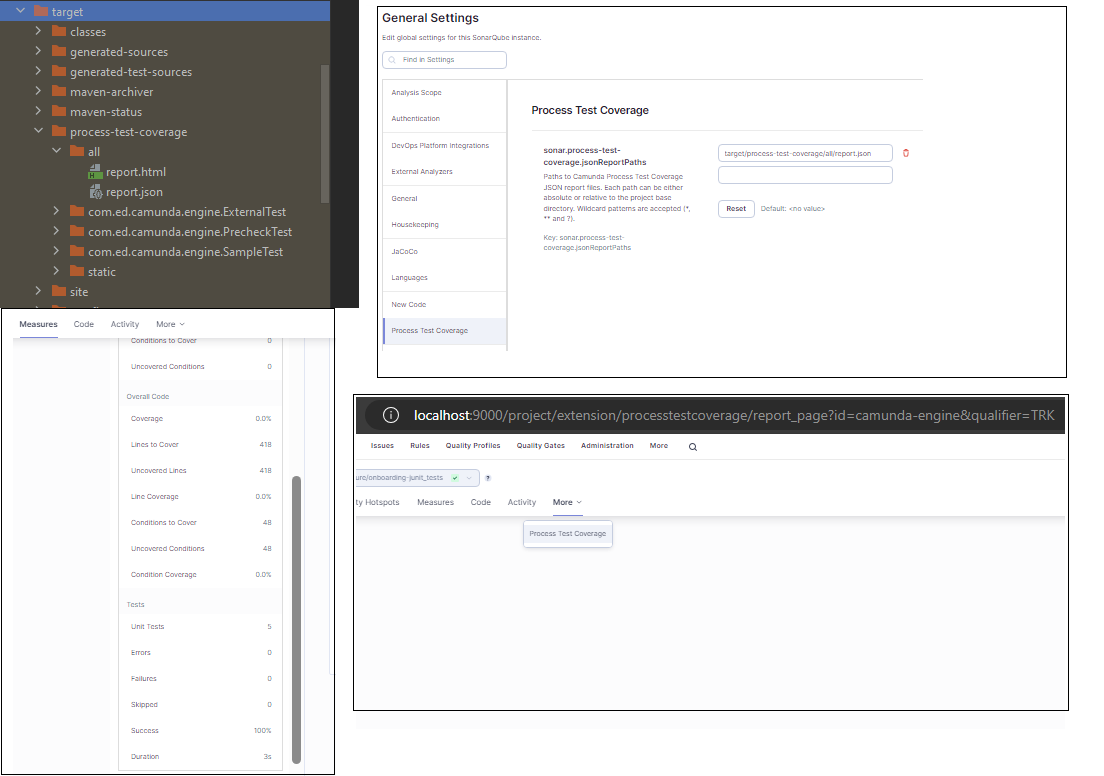
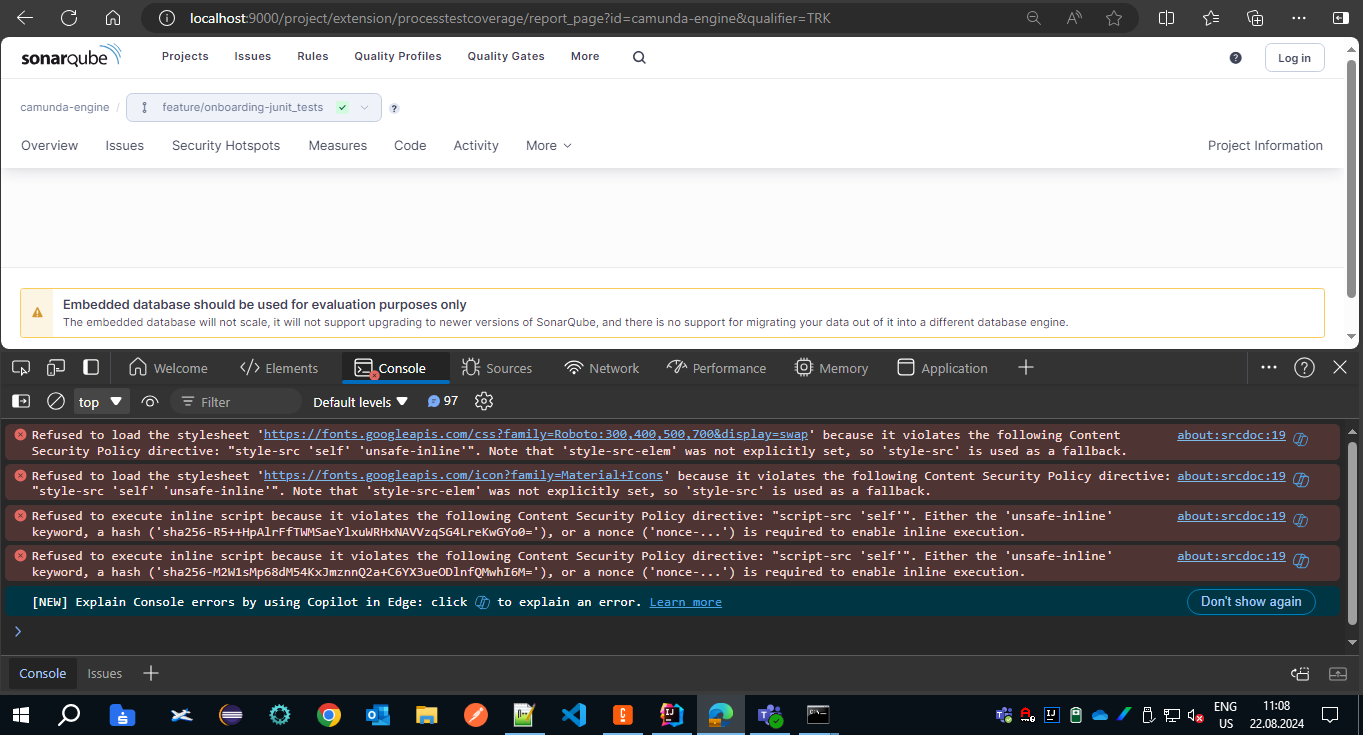
In Process Test coverage getting empty screen, also missing the Process Test Coverage option in Coverage tab.
Kindly please have look on attached screenshot. Kindly suggest on this.
As long as your reports are in the default location (target/process-test-coverage) you don’t need to change the setting in the Sonar plugin (just leave the field empty).
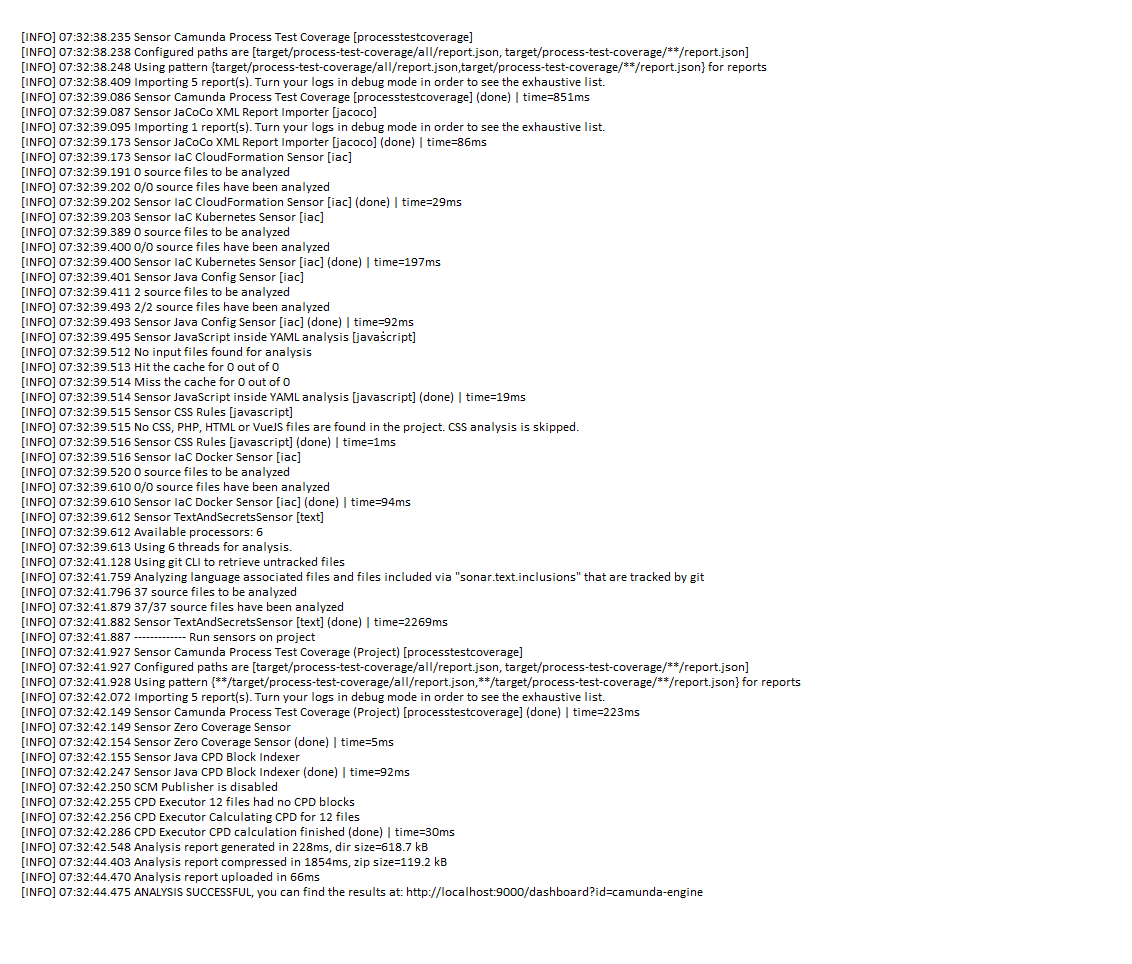
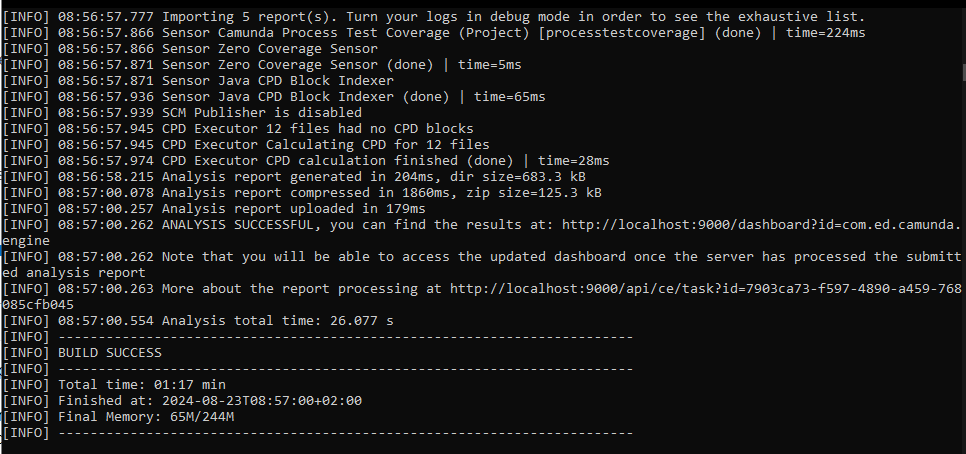
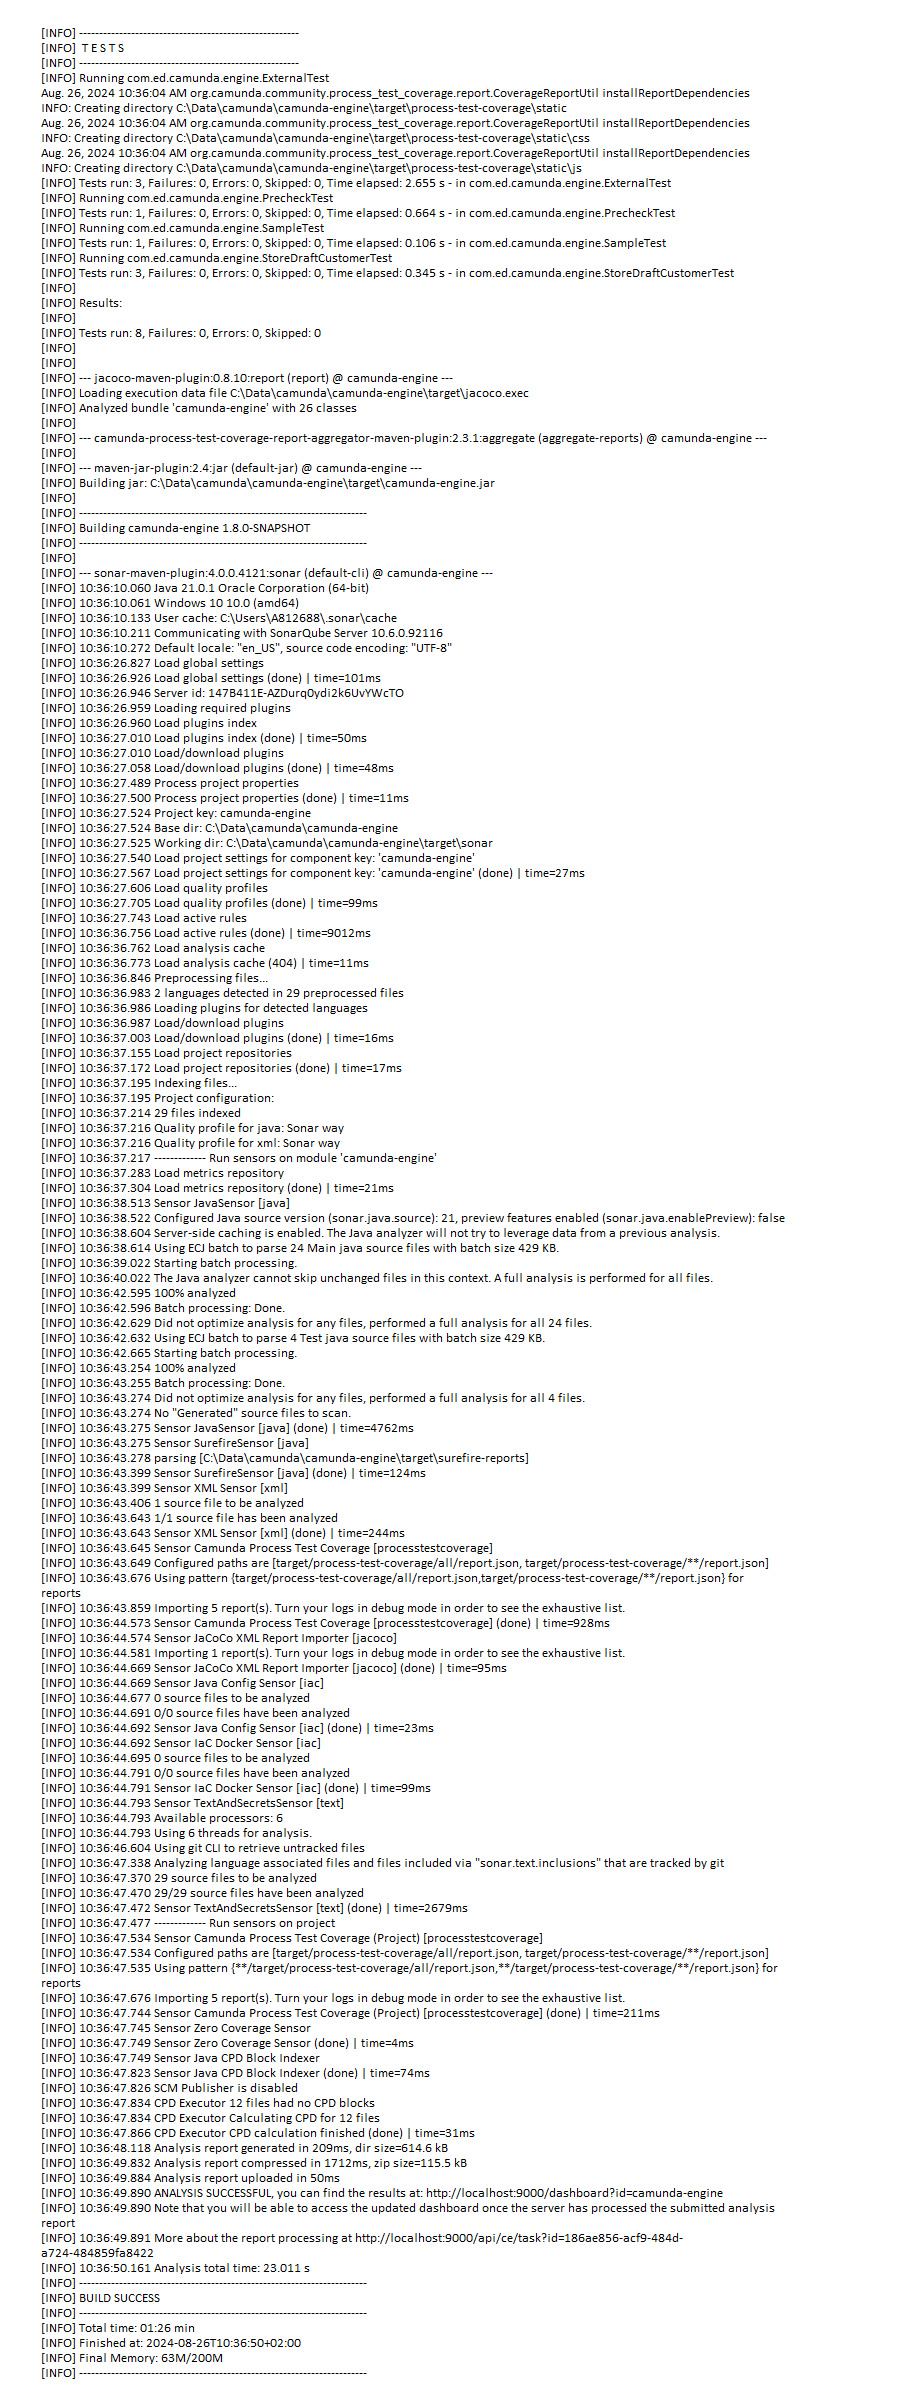
Could you please show me the output of the Sonar analysis (when calling mvn sonar:sonar)?
There should be some line like:
"Importing {} report(s). Turn your logs in debug mode in order to see the exhaustive list."
Very strange. As we can see from the log, it’s picking up the reports just fine.
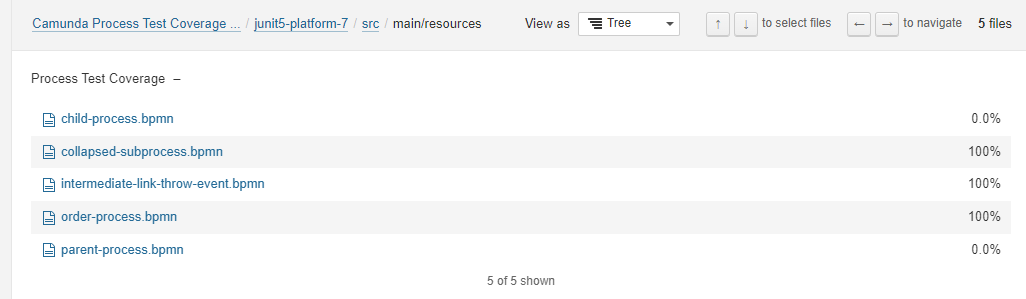
If you navigate to the BPMN files in Sonarqube, you see no coverage measure?
I have those same exceptions in the console and it’s still working for me.
If you don’t see the BPMN files under code section, then you have a problem that those are not picked up by the sonar analysis.
Please be sure to again check your sonar.sources property you pass to the maven plugin. It should include the bpmn files for your processes you test.
Hello @Veb
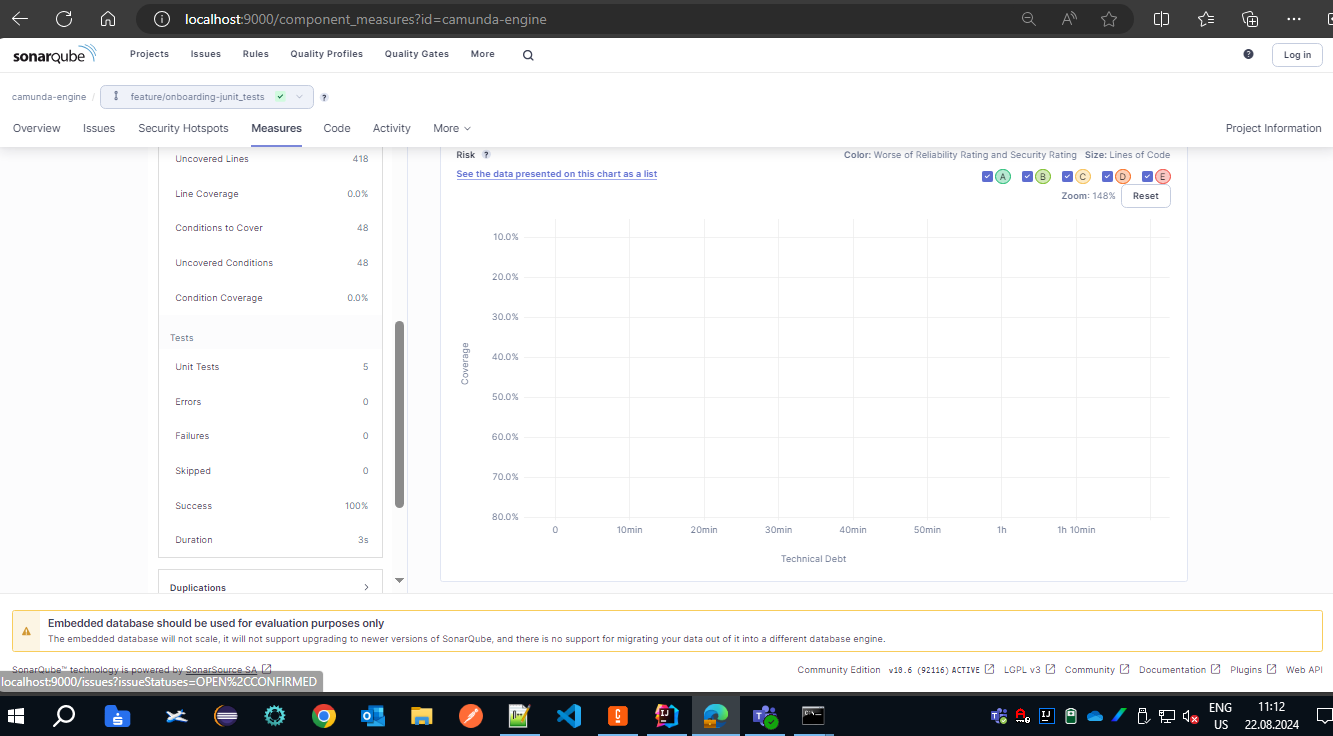
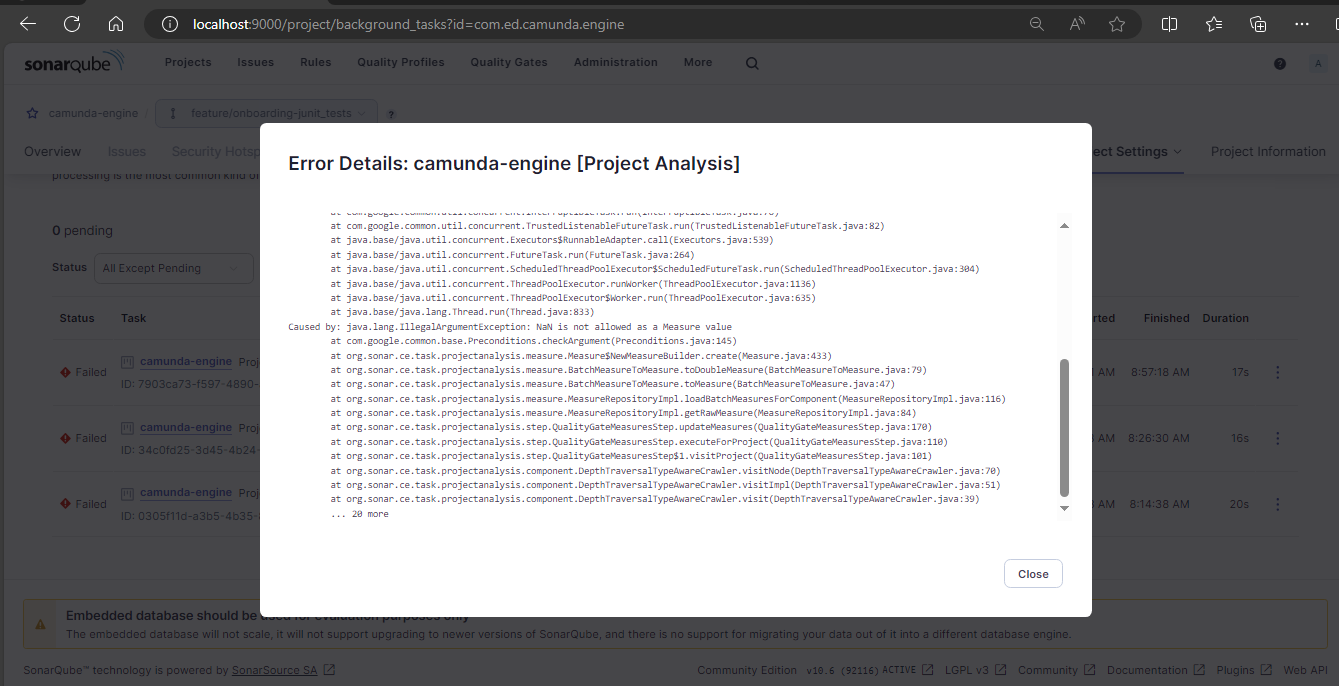
There’s some test that is registered with the extension, but no Camunda events are thrown (maybe not a relevant process test).
Currently that leads to a coverage of NaN and will apparently fail, when imported to Sonarqube.
With the upcoming version 2.7.0 this situation will be fixed and such tests will be ignored.
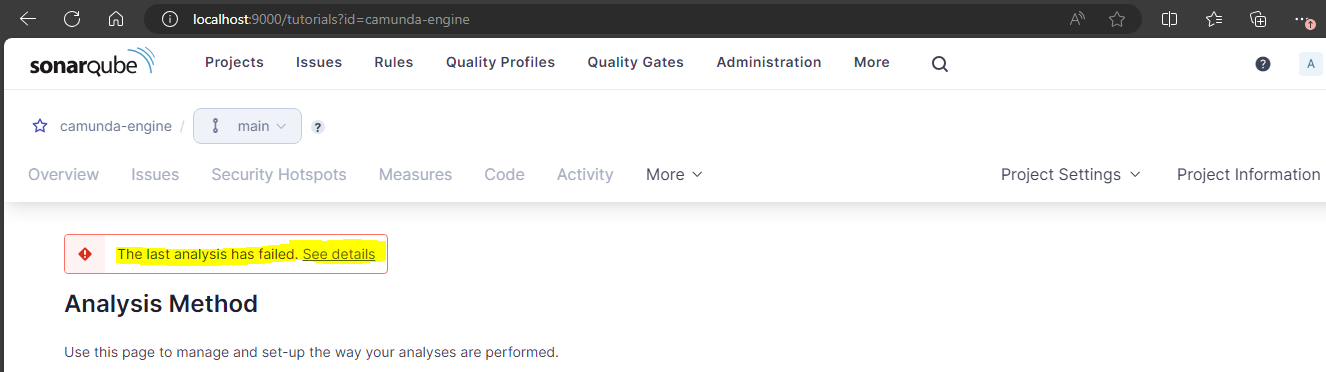
Even though I didnt changed anything not test classes still this error raised in Sonarqube, As Last Analysis has failed.
Any Solution over this @rohwerj
Thank You
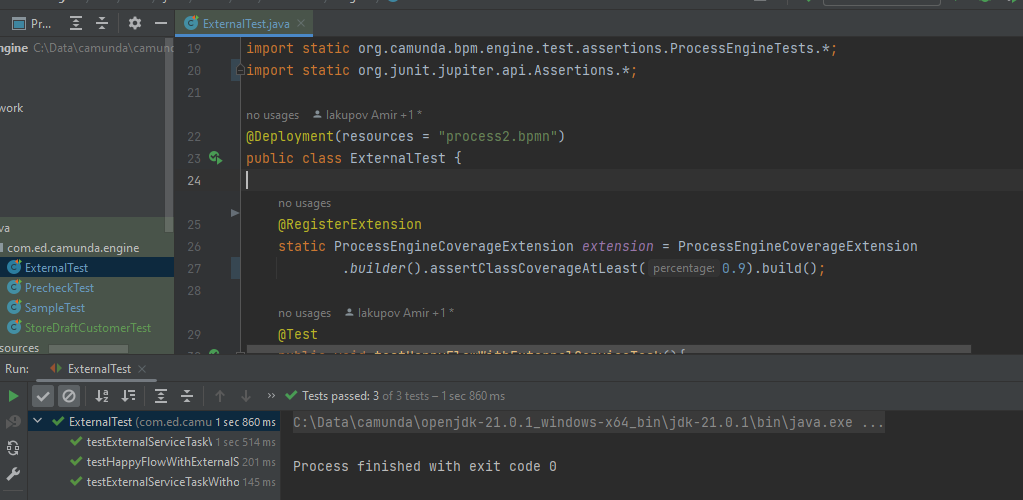
Hi @Veb
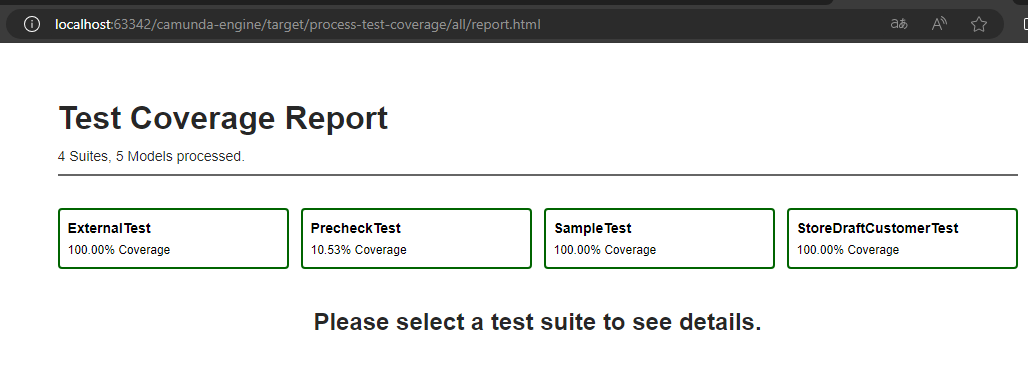
Watch the output of the test execution. There should be at least one test class, where you see something like
Test coverage of … is NaN.
Use the annotation @ExcludeFromProcessTestCoverage to exclude this test class from the coverage, as it anyway captures no events from Camunda.
In the next version 2.7.0 this test class will be automatically ignored, but currently you have to explicitely do this.
You would only see that output on the console, not in the HTML report.
We just released version 2.7.0, which handles this situation better.
Could you please test, whether that version solves your problems?