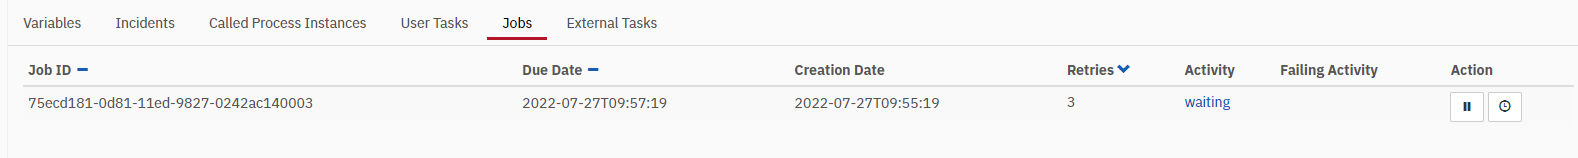
Hi all Camnuda experts, we have a very stupid problem. My process stucks on the timer and camunda ist not getting the job aquised. If i deploy my bpmn file the same timer works fine but after some time or situatios is stukcing on the timer like following screenshot… It must be something with camunda settings… Do you have any idea or suggestions on this job executor problem?.. I am using camunda bpm 7.17 in docker container.
I see the job created from timer and is there as you can see in the screenshots. The only problem ist this job could not be proceeded in camunda and it stays on the job list altough duedate ist over. Do you know the reason? Any Ideas?
Hi Niall, thanks for your respons. Actuall i am using the standart settings. There are no extra settings from me. If i deploy my bpmn model it works again, but after some time it doesnt work any more. As a work around i have tried following settings but there is no change. It still happens:
Hi,
I’d suggest going through this article: The Job Executor: What Is Going on in My Process Engine? - Camunda and trying out the different tips from it to diagnose the problem. Job executor settings issues are quite hard to diagnose without deeper knowledge about the resources and setup. In my case which had similar symptomps (environment worked fine, then it stopped executing jobs and only restart helped) only thread dump combined with log analysis helped me diagnose the real issue (in my case job executor got stuck processing the same jobs over and over again due to the way http connector works in Camunda).
Hope that helps.
Hi Eileen, many thanks for your response. We are processing the same job over and over again (in loop logic). But i didnt get your solution. What was the solution with http conntector?
I’ve seen this situation at a customer live the reason was, that some rest calls didn’t get a response by the called endpoint. They ran forever and filled the queue of the job executor. When the queue is full, the engine could not pick up any job and all processes get stuck.
Eventually they set a timeout on the called rest api and the engine behaves as expected. They saw incidents for the failed calls and all successful tasks were completed.
Hi,
the solution was exactly as Ingo already described in the post above - introducing timeouts for the calls. We also discourage our users from using connectors in their diagrams and are slowly switching to external workers.
the problem is solved finally. In our docker containers job executor was deployment aware. Thats why they wont be selected from JobExector. In somehow they work at the beginning of bpmn deployment but after some time no more and they stuck in waiting.
I can not explain how the selection internally works with deployment id but here are the sqls comparision from my case.
– Before the config change…
Preparing: select RES.ID_, RES.REV_, RES.DUEDATE_, RES.PROCESS_INSTANCE_ID_, RES.EXCLUSIVE_ from ACT_RU_JOB RES where (RES.RETRIES_ > 0) and ( RES.DUEDATE_ is null or RES.DUEDATE_ <= ? ) and (RES.LOCK_OWNER_ is null or RES.LOCK_EXP_TIME_ < ?) and RES.SUSPENSION_STATE_ = 1 and (RES.DEPLOYMENT_ID_ is null ) and ( ( RES.EXCLUSIVE_ = true and not exists( select J2.ID_ from ACT_RU_JOB J2 where J2.PROCESS_INSTANCE_ID_ = RES.PROCESS_INSTANCE_ID_ – from the same proc. inst. and (J2.EXCLUSIVE_ = true) – also exclusive and (J2.LOCK_OWNER_ is not null and J2.LOCK_EXP_TIME_ >= ?) – in progress ) ) or RES.EXCLUSIVE_ = false ) LIMIT ? OFFSET ?
– After the config change…
Preparing: select RES.ID_, RES.REV_, RES.DUEDATE_, RES.PROCESS_INSTANCE_ID_, RES.EXCLUSIVE_ from ACT_RU_JOB RES where (RES.RETRIES_ > 0) and ( RES.DUEDATE_ is null or RES.DUEDATE_ <= ? ) and (RES.LOCK_OWNER_ is null or RES.LOCK_EXP_TIME_ < ?) and RES.SUSPENSION_STATE_ = 1 and ( ( RES.EXCLUSIVE_ = true and not exists( select J2.ID_ from ACT_RU_JOB J2 where J2.PROCESS_INSTANCE_ID_ = RES.PROCESS_INSTANCE_ID_ – from the same proc. inst. and (J2.EXCLUSIVE_ = true) – also exclusive and (J2.LOCK_OWNER_ is not null and J2.LOCK_EXP_TIME_ >= ?) – in progress ) ) or RES.EXCLUSIVE_ = false ) LIMIT ? OFFSET ?
Only the diffrence is (RES.DEPLOYMENT_ID_ is null ) used in sql of Deployment aware job executors. If the jobExecutorDeploymentAware is false the all jobs will be seleced and aquised now. It helped also after restart of camunda to execute the any jobs again. It was not the case before the config change.