RESOURCE_EXHAUSTED: Reached maximum capacity of requests handled

Running Zeebe 0.21.1 community and running into the exception above with these details:

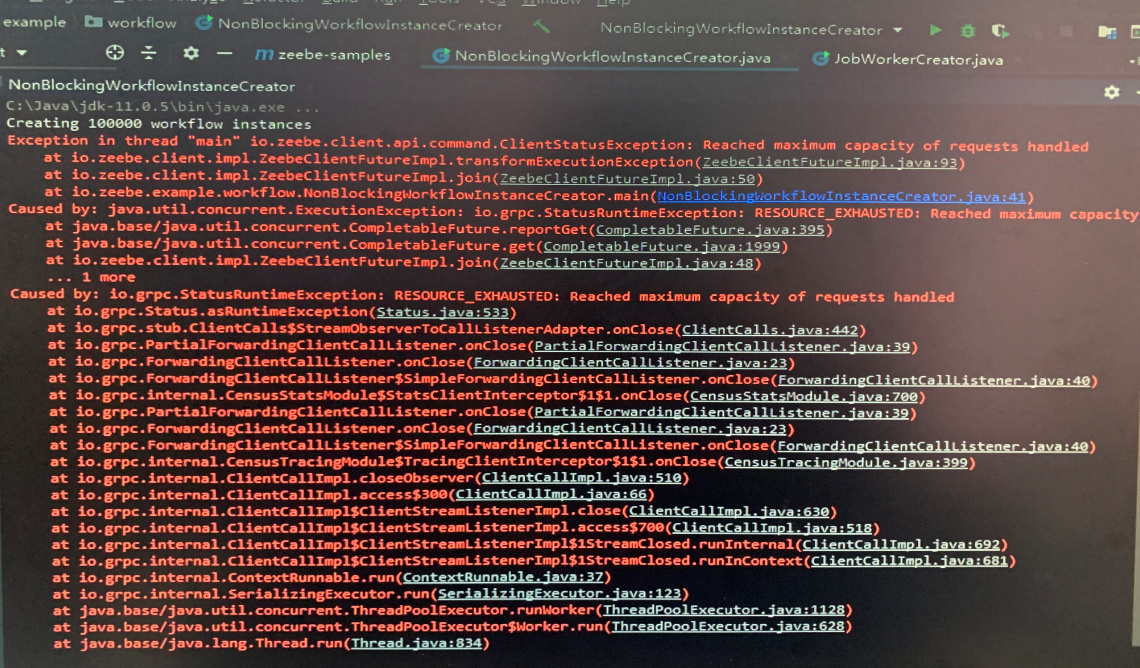
Exception in thread “main” io.zeebe.client.api.command.ClientStatusException: Reached maximum capacity of requests handled
at io.zeebe.client.impl.ZeebeClientFutureImpl.transformExecutionException(ZeebeClientFutureImpl.java:93)
at io.zeebe.client.impl.ZeebeClientFutureImpl.join(ZeebeClientFutureImpl.java:50)
at SimpleHttpBasedProcessApp.main(SimpleHttpBasedProcessApp.java:48)
Caused by: java.util.concurrent.ExecutionException: io.grpc.StatusRuntimeException: RESOURCE_EXHAUSTED: Reached maximum capacity of requests handled
at java.util.concurrent.CompletableFuture.reportGet(CompletableFuture.java:357)
at java.util.concurrent.CompletableFuture.get(CompletableFuture.java:1895)
at io.zeebe.client.impl.ZeebeClientFutureImpl.join(ZeebeClientFutureImpl.java:48)
… 1 more

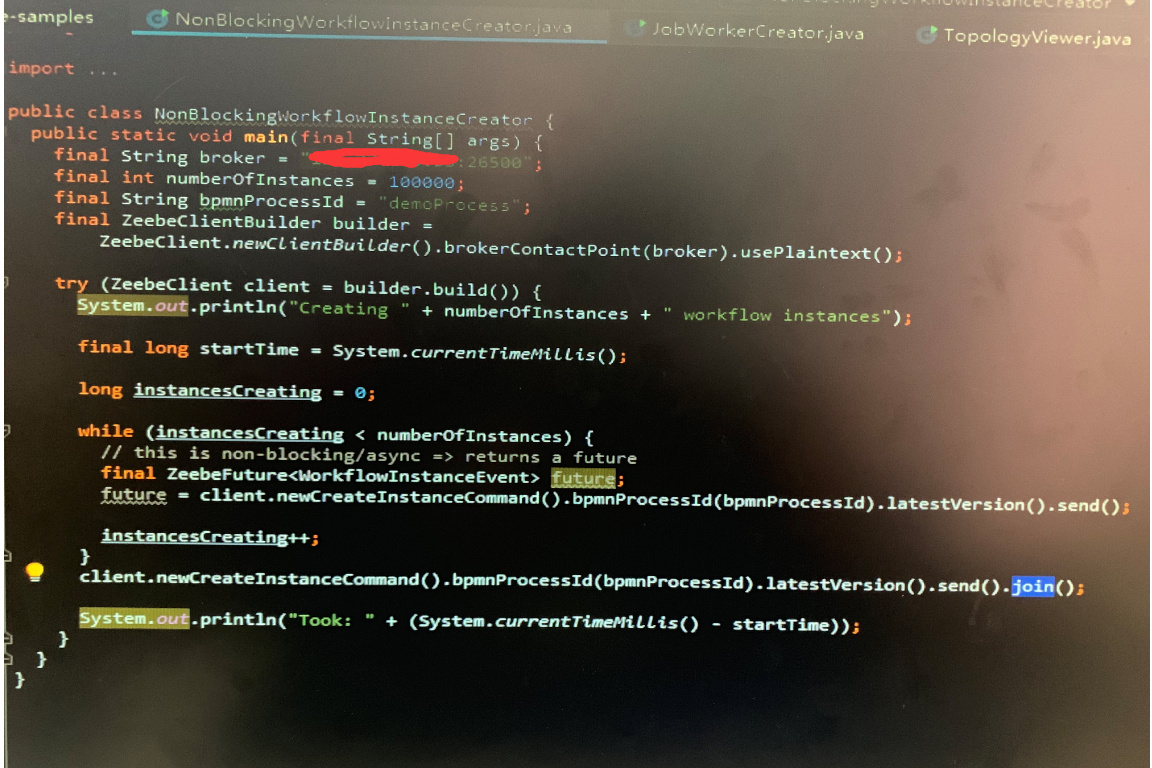
I am running a cluster comprising of 3 nodes using the docker/cluster sample. There are currently no workflow instances in flight. I get this error when attempting to run a single workflow and it occurs for every subsequent attempt in executing the same workflow.

If I run a single instance, I do not seem to run into this same problem. What could I be doing wrong?

@klaus.nji That sounds like the new back-presure feature kicking in… can you help us to reproduce the problem?
It might be a configuration issue…

Look here: https://github.com/zeebe-io/zeebe/pull/3035/files#diff-36a3b3365a45cabcdc35975f05a1bcabR140 . (found this via the release notes)

If you set the log level to trace you will see if it is broker backpressure.

Ok more hints:

  1. you can get that exception if your brokers are experiencing problems of memory or if they are being killed for some reason, that exception might appear while the partition leaders are being elected
  2. How many workers do you have? Are you creating tons of workers?
  3. Can you share the logs of the brokers?

Let’s work together to find what the root cause of the problem is.

Thanks for the quick responses. I am also suspecting a configuration problem but some specifics:

I am attempting to run the cluster on a single box, a MacBook Pro. My hardware specs are as follows:

Model Name: MacBook Pro
Model Identifier: MacBookPro15,1
Processor Name: Intel Core i7
Processor Speed: 2.6 GHz
Number of Processors: 1
Total Number of Cores: 6
L2 Cache (per Core): 256 KB
L3 Cache: 9 MB
Memory: 32 GB
Boot ROM Version: 220.230.16.0.0 (iBridge: 16.16.2542.0.0,0)
Serial Number (system): C02X9581JGH6
Hardware UUID: F965A559-C0C9-5FBA-A142-B06CFF3D42DA

I also read somewhere that a cluster needs to run on as many physical processors or cores(?)… as the number of brokers. So do not know if this is the problem here.

@salaboy, here are some answers to your questions:

  1. you can get that exception if your brokers are experiencing problems of memory or if they are being killed for some reason, that exception might appear while the partition leaders are being elected

I doubt this but will verify again. I usually prune the docker volumes before starting a new experiment.

  1. How many workers do you have? Are you creating tons of workers?

Not really. I am manually running a single workflow.

  1. Can you share the logs of the brokers?

How do I extract the broker logs?

@klaus.nji before nuking your docker containers try docker logs <Container ID> https://docs.docker.com/engine/reference/commandline/logs/

Regarding running a single workflow instance… it doesn’t really matter if you have 1000 workers polling for jobs. So how many Zeebe Workers do you have running?

HTH

@salaboy, when this happened, I did not have many worker instances running. Perhaps 10 max/ . Certainly not in the thousands.

Can you please try to reproduce and share the logs?

@salaboy, if I get into that state again, I will sure capture the logs. Strangely enough I have not been able to see the error again.

But is it acceptable to run a Zeebe cluster on a single box? I have one physical CPU with 6 cores.

@klaus.nji yes I think it is… as soon as you don’t expect it to scale massively… is that for dev purposes right?

hi ,
I also encountered the same confusion,here is my log

and i have 3 brokers and 1 gateway.

What is wrong with this?

@ salaboy
here is my code

@jarume so you are sending requests as fast as you can and due your setup the broker is telling you that it cannot handle as many requests as you want and send a special error code for the client to slow down. that is the exception that you are getting.
Usually, instead of sharing screenshots, we put code in GitHub and create unit tests to make sure that we can reproduce the problem.

1 Like

You can await the Future before starting the next workflow, or for max parallelism you can write a state machine that wraps operations and does a backoff-retry on gRPC Status 8. That’s the approach I took in the Node library (see https://github.com/creditsenseau/zeebe-client-node-js/blob/master/src/zb/ZBClient.ts#L640).

There is a cool .NET library called Polly that does it. I’m looking at using the Node port (called Cockatiel) in the Node client (see: https://github.com/creditsenseau/zeebe-client-node-js/issues/115).

I’d PR it into the .NET client, because you don’t want to have to write that for every application.

1 Like

See here: https://github.com/zeebe-io/zeebe-client-csharp/issues/69

hi, @jwulf, @salaboy. I also encountered this error
StatusCode=ResourceExhausted, Detail="Reached maximum capacity of requests handled"

I am now stress testing and creating 200 requests in 1 second.

A workflow is called by multiple clients at the same time. How much concurrency can the zeebe service support?(alone gateway,cluster with 3 nodes)

my Test Result:
create 50 workflow instances in 1s, 18 workflow instances have error:ResourceExhausted
The rest are successful. Higher error rate:sob:

There is your answer. On that hardware, with that cluster configuration, that is your limit.

You would use client-side retry if this were a burst, so that when the load comes down on the creations, they catch up.

If it is sustained, you need more brokers or more resources (Compute/Memory) for each of your brokers.

@jwulf. thanks for responses.

What is the hardware configuration required for high concurrency scenarios, and
how modify the cluster configuration file?

Has Zeebe Cluster been stress tested? Is there a stress test report?

Every system has a performance envelope.

It depends on what you do with it.

Do you need sustained create instances at a certain level? Or does it burst? What kind of load is involved in actually processing your workflows?

Do they have transformations or complex decisioning in them?

How many task types with polling workers do you have? How many instances of workers?

What about end-to-end latency? What’s more important in your scenario? The ability to start workflows with no front-buffering, or time to complete a workflow once it starts?

There are so many variables that generic performance tests are useless.

If a test shows that you can start 2000 workflows/second, but you find out later that you need to wait 5s for each one to complete under that load - and you need it to be 3s, now what?

What happens if you add 1G RAM to each broker in that scenario? What about more CPU? What about more brokers? Or less? Or less replication? Or more partitions?

You have to build a mock scenario that matches your use-case, and performance profile it yourself, systematically mapping the performance envelope.

Yes there are tests and benchmarks, and you can see them on the blog. But there is no substitute for doing it with your use case.

From experience: I performance profiled Zeebe in late 2018/early 2019, and the wf instance create in our configuration was sufficient. I used a repo that Bernd made that Terraforms an AWS cluster with massive nodes in it.

It was only later that we discovered that end-to-end processing of a workflow on 0.22-alpha.1 incurs a 34-52ms overhead per BPMN node, and you can’t affect that with more brokers because it all happens on a single broker - and we needed it to be 100ms for the entire workflow. (It will get faster but not in 0.22).

We should have profiled the performance envelope of the entire system, systematically, with the parameters of our use-case and a representative workload.

There is no substitute for that, and someone else’s performance test will not match your parameters. So benchmarks should all be taken with a grain of salt, except for your own, which you bet your tech stack on.

1 Like

The only thing these are ultimately good for is getting ideas on how you write your own benchmarking / profiling.

1 Like