Hey everyone,
I could need some help with the design of a BPMN-Diagram and I would be really glad, if someone could make a review on my attached example.
The Background:
At the moment we’re around 50 old Spring Batch-Processes with a lot of business logic behind it. These logic is hidden to our business analysts, who need to work with it, but don’t have the time / knowledge to dive into the Spring Batch-Code. That’s why we decided to introduce the Business Process Model and Notation (BPMN) and extract the logic from the code.
But since we are all new to the topic, my team is not sure how to transfer a given process into a BPMN-Diagram.
The Process:
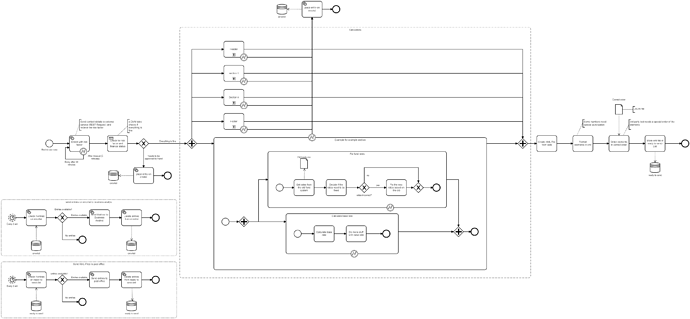
The main Process is quite basic: Raw data gets in and will be enriched by external sources. After that calculations run, an XML will be generated and send to post office of our company.
The heart (and probably the tricky part) of the process are the calculations, which are quite few (<100) and complex.
The Diagram
I came up with the following BPMN-Diagram:
You can also find it here on cawemo:
https://cawemo.com/share/ccbcc38e-9ee1-4dd0-8e23-55ba3e6ca322
To simplify the process a little, I used only a example for the calculations in the open sub process.
The Questions:
I don’t feel very comfortable with the drawn process and probably you can help me out a bit with the following questions:
-
The two blocks on the downer left (“send entries on errorlist to business analyst” and “Send XML-Files to post office”) should run every day on 2 am. Are they placed correct in the diagram or would they only be fired, when the main process is running? In that case it would be better to exclude them in some seperate files and start them with an external schedular?
-
The main part of the process are the calculations, which are hidden in some sub processes. I opened only one of them in order to show you, that they are also hidding more sub processes underneath. Is this a correct way to do or is there a better way? Keep in mind, that these two subprocesses are only an example and the number can grow up to around 100. I’m a little worried, that it will be really fast unreadable due to too much informations on the diagram.
(Question besides this: Is it possible to hop to an underlying process in Cawemo or the Camunda Modeler?) -
In the end I want to create a XML file based on the data, which comes from the calculations, but also from the original raw data. I don’t have the feeling that this information is visible at all in the diagram, instead the task “Create XML File from data” could create an empty file and everything would be fine for the process. Is this a problem or do I overthink this a little?
-
Do you have any other tips or advices for the diagram?
Thanks for your help!
Best regards,
Philipp
