Slow loading of cockpit process instance statistics

Hi,

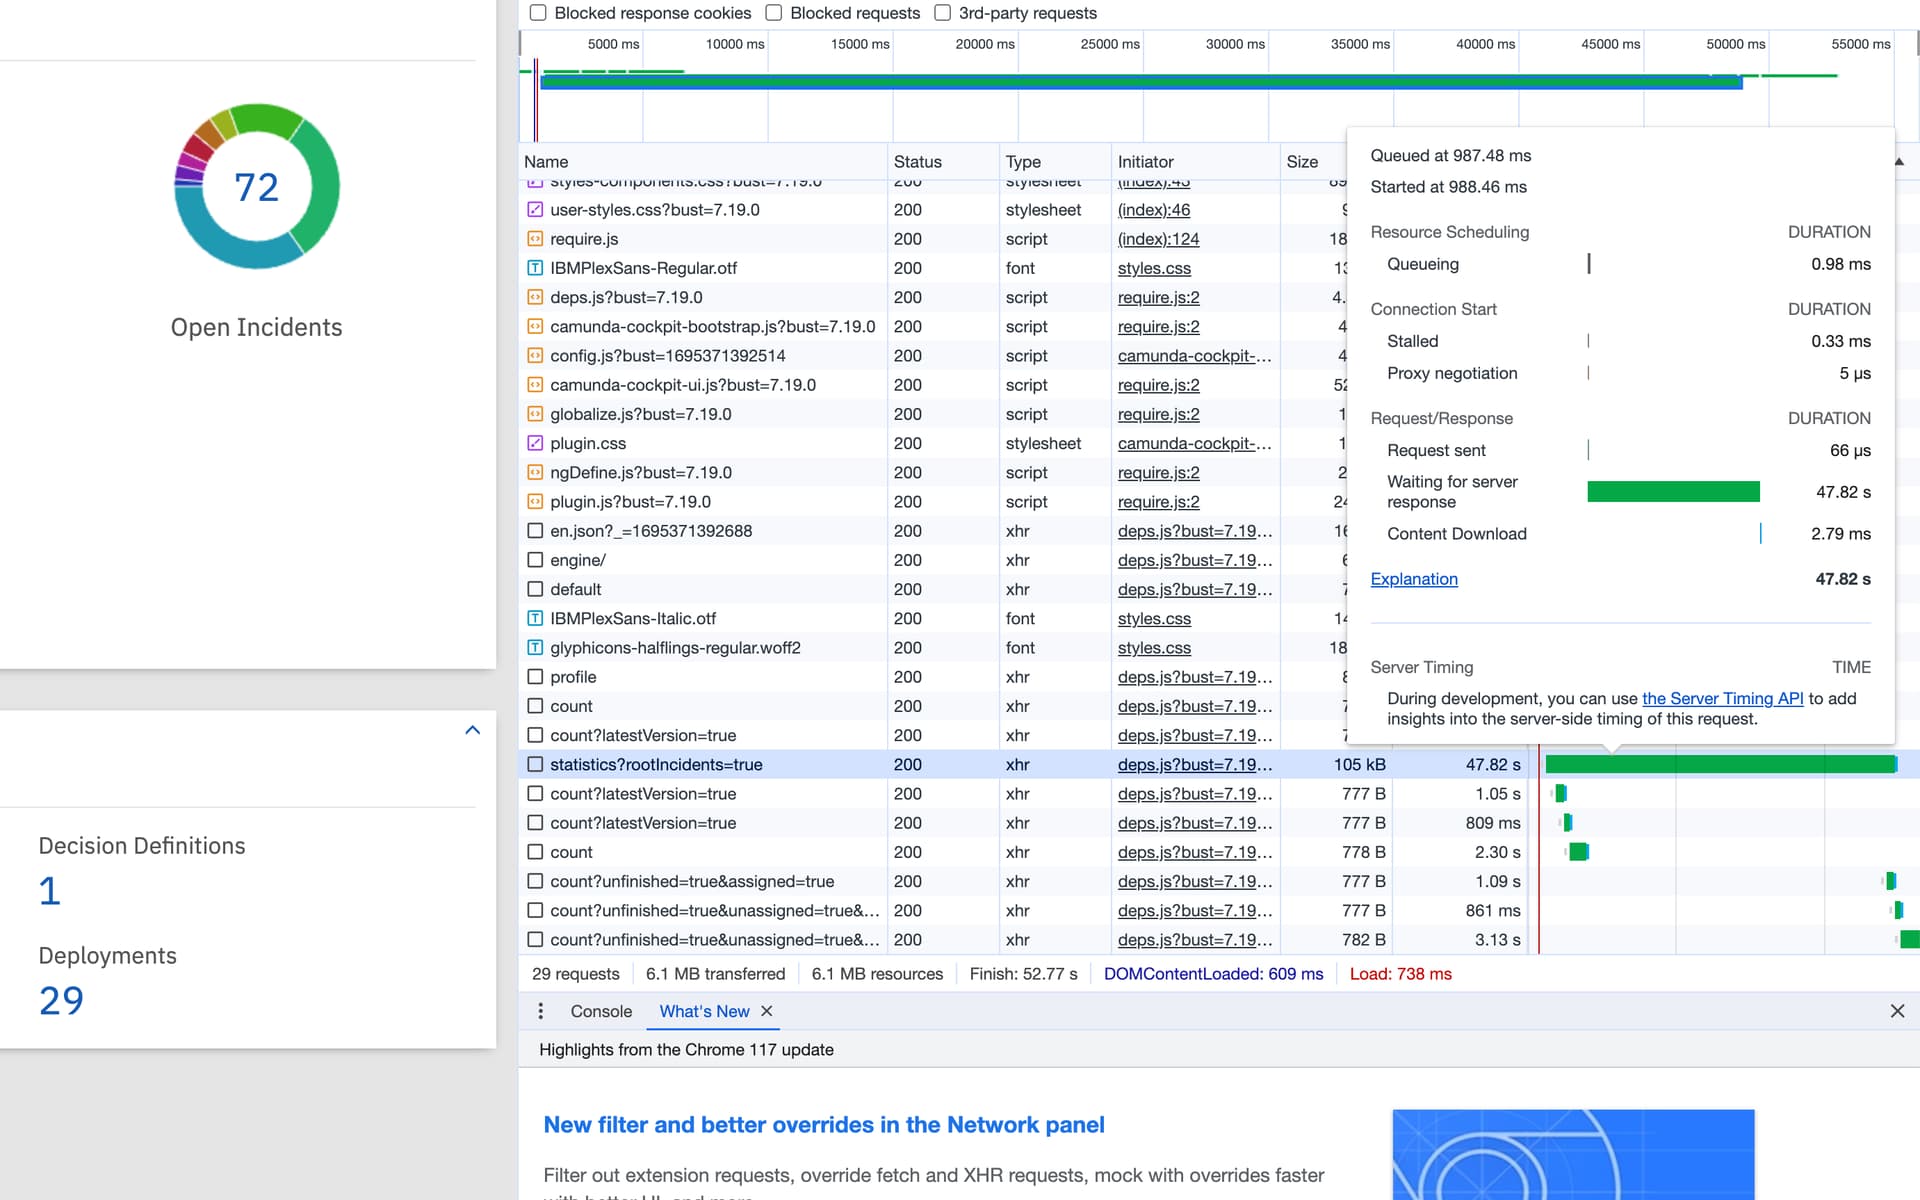
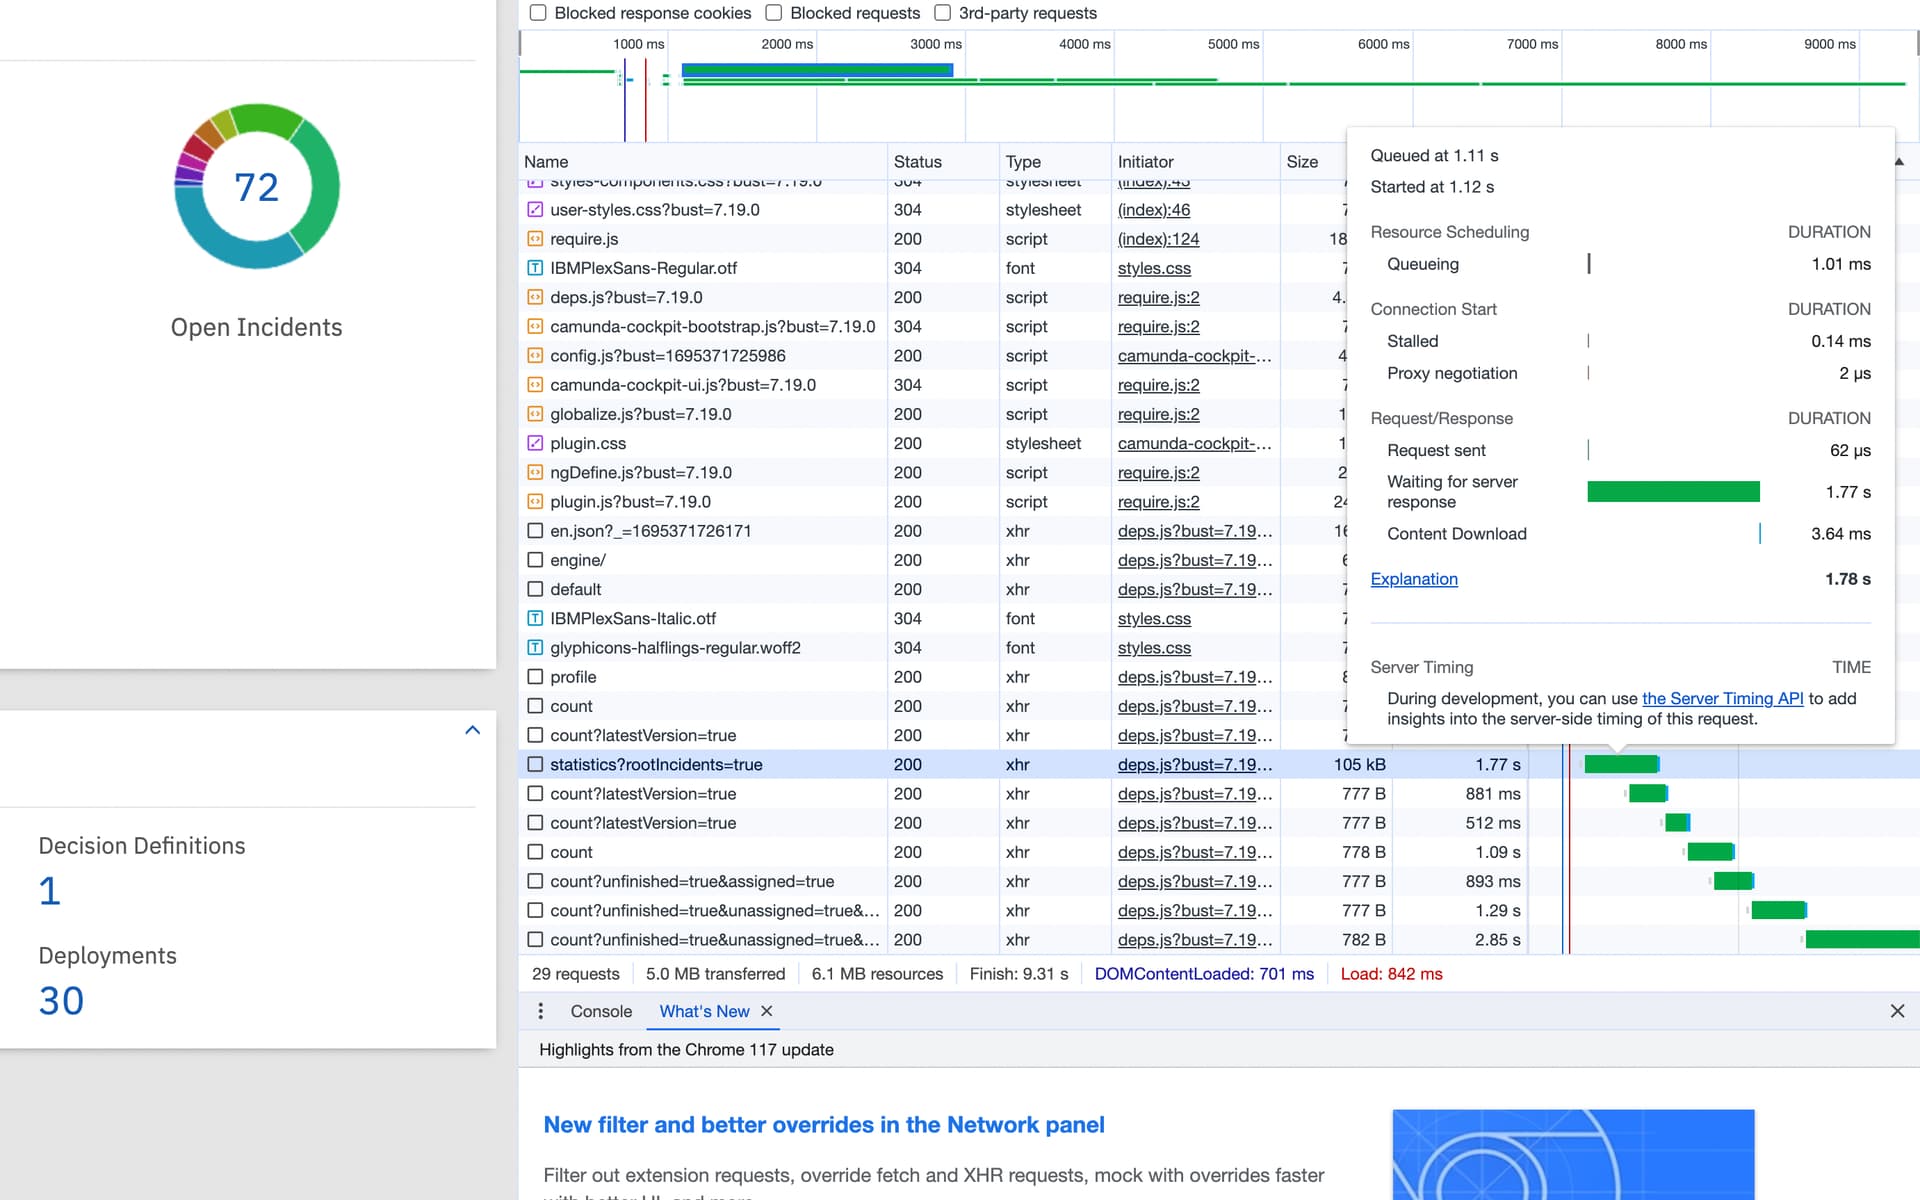
We are having trouble loading some cockpit pages, such as the dashboard and processes. Judging by the devtool, the problematic request goes to /process-definition/statistics?rootIncidents=true and query looks like:

SELECT DISTINCT RES.*
FROM
  (SELECT PROCDEF.*,
          INSTANCE.INSTANCE_COUNT_,
          INC.INCIDENT_TYPE_,
          INC.INCIDENT_COUNT_
   FROM ACT_RE_PROCDEF PROCDEF
   LEFT OUTER JOIN
     (SELECT E.PROC_DEF_ID_,
             count(E.PROC_INST_ID_) AS INSTANCE_COUNT_
      FROM ACT_RU_EXECUTION E
      WHERE E.PARENT_ID_ IS NULL
      GROUP BY E.PROC_DEF_ID_) INSTANCE ON PROCDEF.ID_ = INSTANCE.PROC_DEF_ID_
   LEFT OUTER JOIN
     (SELECT I.PROC_DEF_ID_,
             I.INCIDENT_TYPE_,
             count(I.ID_) AS INCIDENT_COUNT_
      FROM ACT_RU_INCIDENT I
      GROUP BY I.PROC_DEF_ID_,
               I.INCIDENT_TYPE_) INC ON PROCDEF.ID_ = INC.PROC_DEF_ID_) RES
ORDER BY RES.ID_ ASC
LIMIT ?
OFFSET ?

After some analysis, we came to the conclusion that the bottleneck here is the repeated access to data from ACT_RU_EXECUTION. The subquery itself takes about 100ms to process, but in the full query I attached above it is called ~800 times, so we end up with a long execution time. This query can be optimized, however I’m not sure if this can be done in Camunda:

WITH a AS materialized
  (SELECT E.PROC_DEF_ID_, count(E.PROC_INST_ID_) AS INSTANCE_COUNT_
   FROM ACT_RU_EXECUTION E
   WHERE E.PARENT_ID_ IS NULL
     AND (E.TENANT_ID_ IS NULL)
   GROUP BY E.PROC_DEF_ID_)
SELECT DISTINCT RES.*
FROM
  (SELECT PROCDEF.*,
          INSTANCE.INSTANCE_COUNT_,
          INC.INCIDENT_TYPE_,
          INC.INCIDENT_COUNT_
   FROM ACT_RE_PROCDEF PROCDEF
   LEFT OUTER JOIN
     (SELECT *
      FROM a) INSTANCE ON PROCDEF.ID_ = INSTANCE.PROC_DEF_ID_
   LEFT OUTER JOIN
     (SELECT I.PROC_DEF_ID_,
             I.INCIDENT_TYPE_,
             count(I.ID_) AS INCIDENT_COUNT_
      FROM ACT_RU_INCIDENT I
      GROUP BY I.PROC_DEF_ID_,
               I.INCIDENT_TYPE_) INC ON PROCDEF.ID_ = INC.PROC_DEF_ID_) RES
ORDER BY RES.ID_ ASC
LIMIT ?
OFFSET ?

Here the subquery is taken into materialization, in general the query remains the same, only the order and algorithm have changed, but it is executed in 100ms.

Are there any optimization options?

7.19.0 Camunda version
21 process definitions deployed
160k Running Process Instances
26 Deployments

Thanks

4 Likes

Hello my friend!

I believe that one of the main reasons for this delay in loading instances is precisely the number of instances you have running in your processes and the available infrastructure resources.

To load the instances that are running, Camunda searches the “act_ru_execution” table if I’m not mistaken… and the more instances, the longer it takes.

I already had a situation with a Camunda POC that was running on a EC2 T3 Micro on AWS, and with 40k instances running, it was already taking time to search for the running instances and show them in the cockpit… with 65k instances running, it simply crashed all. :neutral_face:

What I did was change from a T3 Micro to T3 Medium and we are running very well with more than 120k instances \o :pray:

Another thing that greatly affects the performance and consumption of the database is the history tables.

Make sure you are using the appropriate strategy, by default it is FULL, that is, it saves all historical data, but this consumes too much of the database’s resources, and generally we don’t need all of this.

I hope this helps.

William Robert Alves

Hi @WilliamR.Alves,

Thanks for your reply.

Do I understand correctly that you solved the problem by increasing resources (T3 Micro > T3 Medium)?
In fact, we faced the history problem earlier and solved it in such a way that we now only store the start time of the process.

Of course, the solution below is not the best, since it is very dependent on the internal implementation of Camunda, however, it has significantly improved the loading of Cockpit pages. I would not recommend using this approach, but if you decide, then:
Override the code that is called on /statistics request so that it executes a custom query:

class CustomStatisticManager : StatisticsManager() {
    @Suppress("UNCHECKED_CAST")
    override fun getStatisticsGroupedByProcessDefinitionVersion(
        query: ProcessDefinitionStatisticsQueryImpl?,
        page: Page?,
    ): List<ProcessDefinitionStatistics> {
        configureQuery(query)
        return dbEntityManager.selectList("customSelectProcessDefinitionStatistics", query, page) as List<ProcessDefinitionStatistics>
    }
}

Register custom manager:

override fun preInit(configuration: SpringProcessEngineConfiguration) {
        configuration.customSessionFactories = listOf(GenericManagerFactory(CustomStatisticManager::class.java))
    }

Override command context:

class CustomContextCommand : CommandContext {
    override fun getStatisticsManager(): CustomStatisticManager = getSession(CustomStatisticManager::class.java)
}

And finally, we need to add the custom query itself:

override fun postInit(configuration: SpringProcessEngineConfiguration) {
    val myBatisConfig = parseXmlConfiguration("mybatis/CustomStatistics.xml")
    val statisticStatement = myBatisConfig.getMappedStatement("customSelectProcessDefinitionStatistics")
    configuration.sqlSessionFactory.configuration.addMappedStatement(statisticStatement)
}

CustomStatistics.xml:

<!-- Process Definition Statistics -->
    <select id ="customSelectProcessDefinitionStatistics" resultMap="processDefinitionStatisticsResultMap"
            parameterType="org.camunda.bpm.engine.impl.ProcessDefinitionStatisticsQueryImpl">
        <include refid="org.camunda.bpm.engine.impl.persistence.entity.Commons.bindOrderBy"/>
        WITH a AS materialized
        (select
        E.PROC_DEF_ID_
        , count(E.PROC_INST_ID_) as INSTANCE_COUNT_
        from
        ${prefix}ACT_RU_EXECUTION E

        where
        E.PARENT_ID_ IS NULL
        <bind name="columnPrefix" value="'E.'"/>
        <include refid="org.camunda.bpm.engine.impl.persistence.entity.TenantEntity.queryTenantCheckWithPrefix" />
        group by
        E.PROC_DEF_ID_)
        ${limitBefore}
        select ${distinct} RES.*
        ${limitBetween}
        <include refid="selectProcessDefinitionStatisticsByQueryCriteriaSql"/>
        ${orderBy}
        ${limitAfter}
    </select>

Results before:


And after:

1 Like

This topic was automatically closed 7 days after the last reply. New replies are no longer allowed.