We are using Camunda 8.5 self-managed
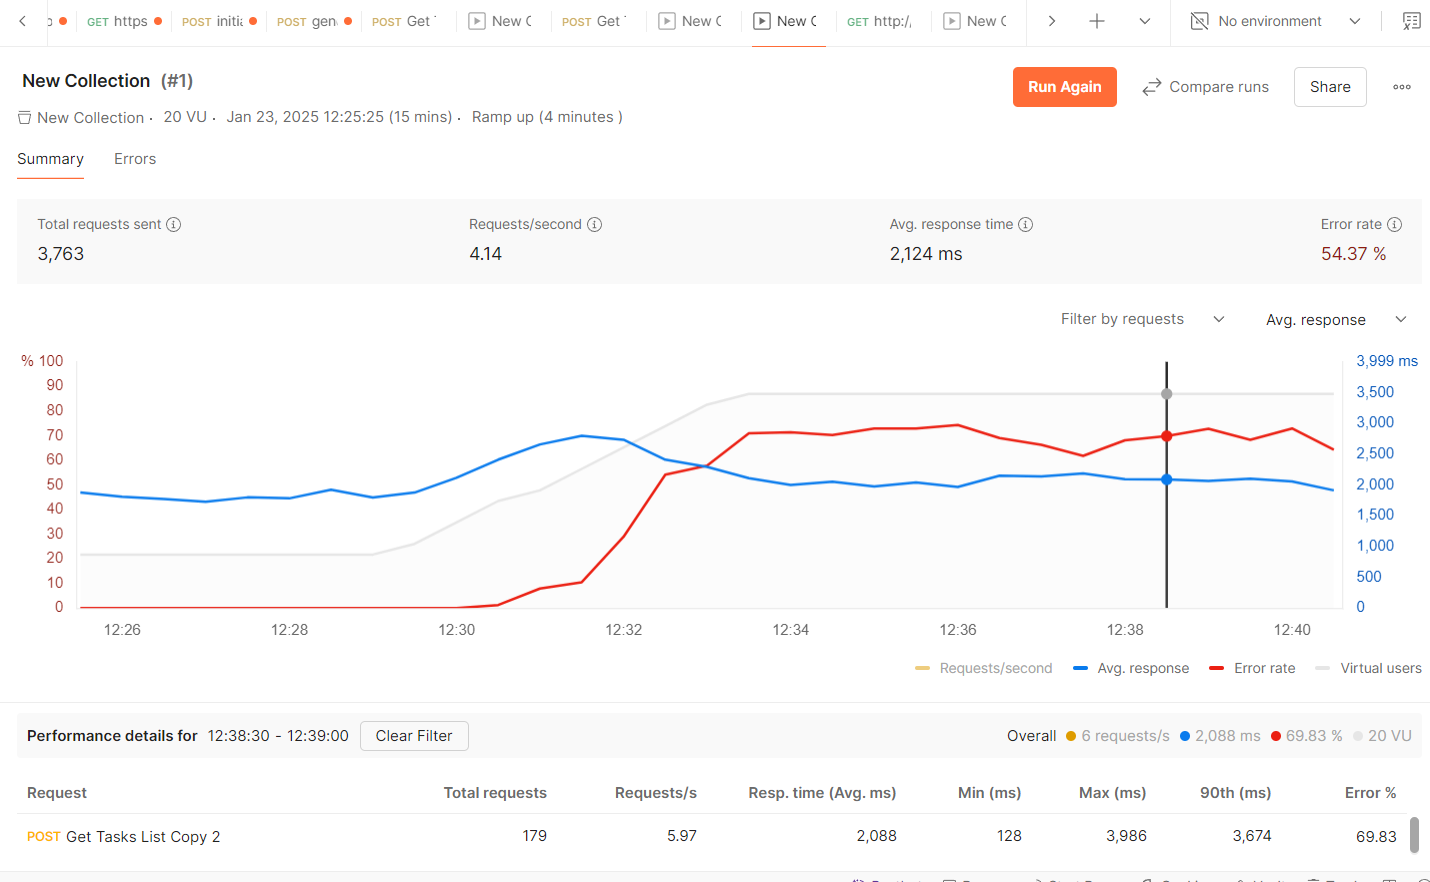
and we are facing performance issue with the tasklist search Api when we try to make a load test with 10 users, ramp up for 10 sec, and duration 15 min through postman.
and kindly note that the error rate is increasing with the number of requests sent to the tasklist at the same time.
Hi @Mohamed_Ahmed_Mohame - please do not tag people unless they’ve already responded to your thread. This isn’t an official/priority support channel, it’s a community forum; if you need more immediate assistance we recommend opening a support ticket.
There are a number of possible causes, but the first I might look at is resource utilization for your Tasklist pod/deployment, as well as resource utilization for Elastic (because Tasklist is querying Elastic to fetch the data). Can you share anything about your deployment (how you’ve deployed it, where, what resources, how you’ve configured it, etc.)? Also curious if you see issues with other Tasklist endpoints, or endpoints of other apps (for instance, Operate)?
Hi @Mohamed_Ahmed_Mohame - what does the resource utilization for the Tasklist and Elasticsearch instances look like? When you start to see errors are those peaking? Do you have issue with other APIs (for instance, Operate), or only Tasklist?
When we try the performance testing with 10 concurrent users, 20 sec ramp up for 15 minutes, we faced the following issue:
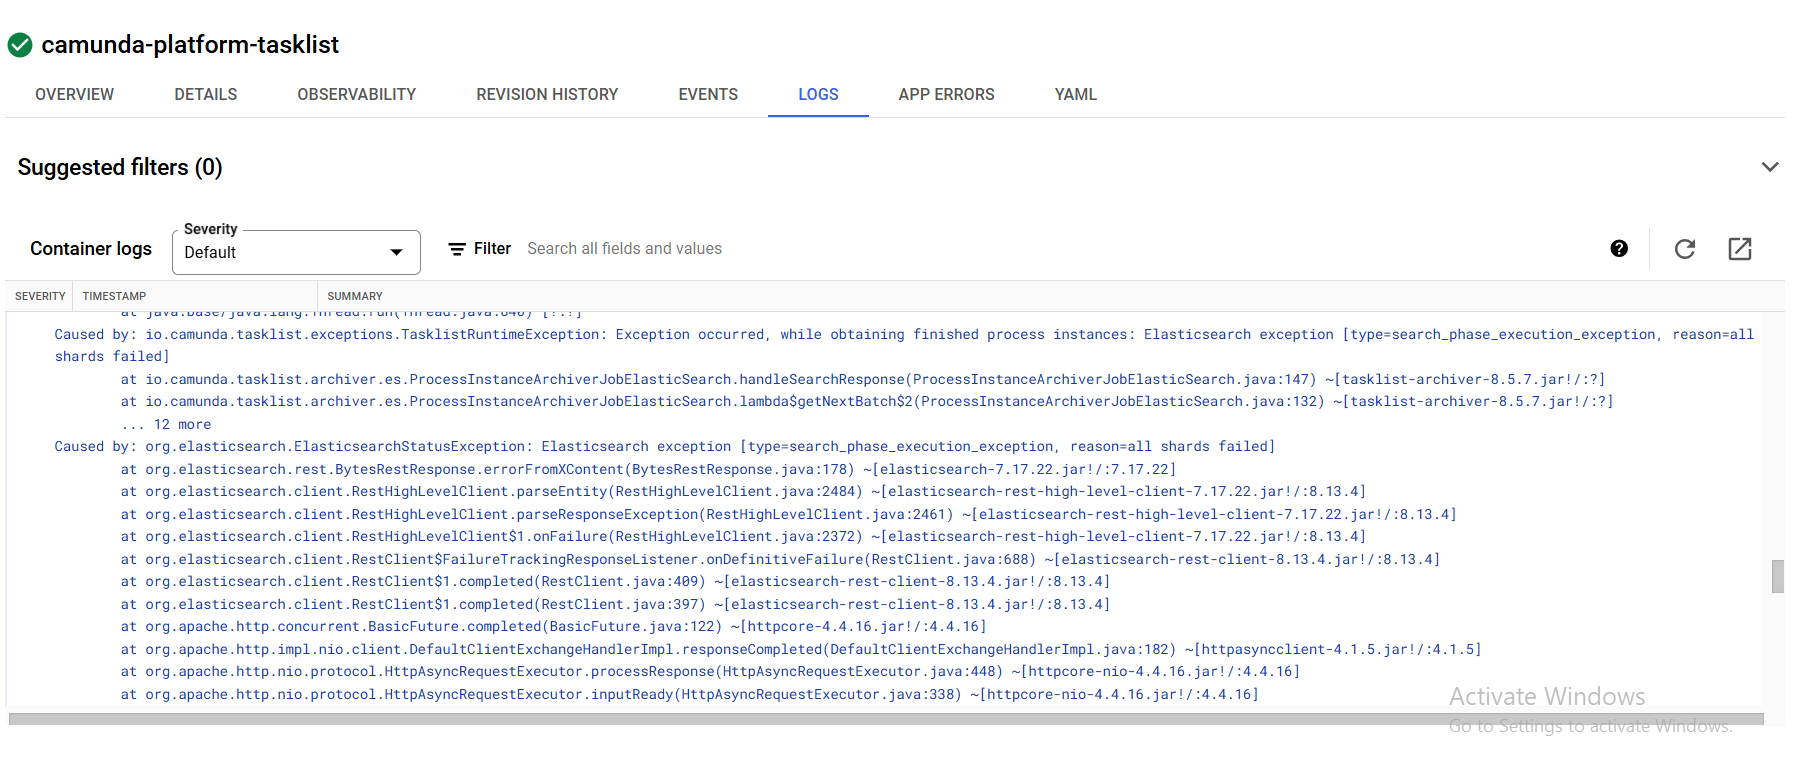
All Elasticsearch shards are down with the following exception
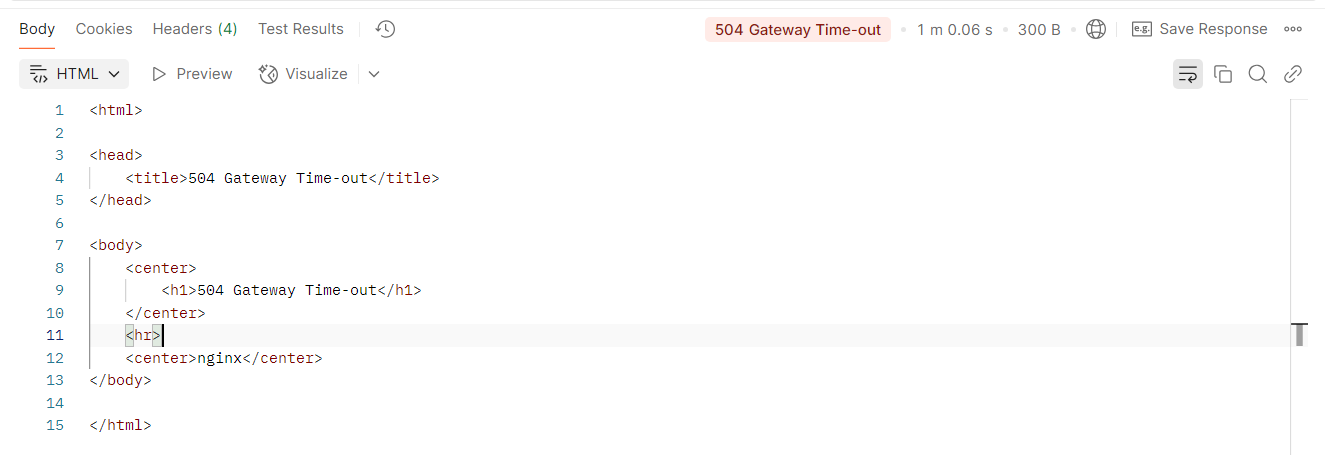
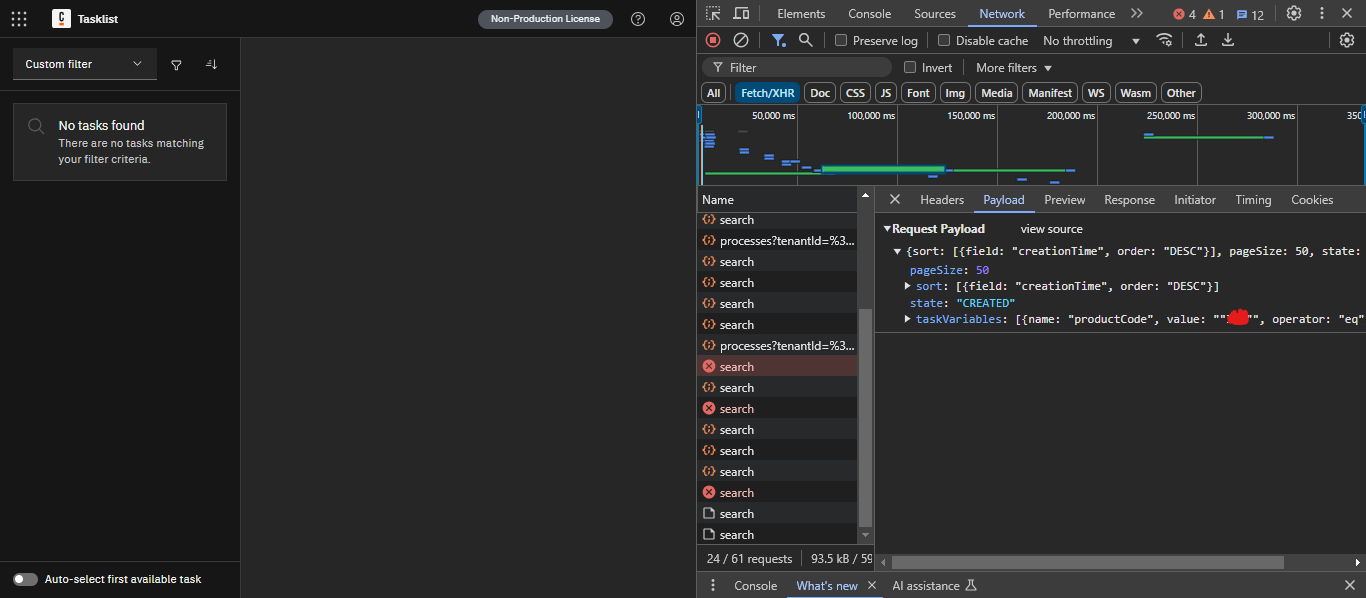
Kindly note that when we add the variables to the body in the search endpoint, we face the following issue but when we exclude them the request is faster and not returning the same error
We start to see the errors after about 5 minutes from the 10 users are using the tasklsit.
and for the second question, actually we don’t use the operate API and we aren’t facing any issue with the operate client.
The same bug appeared in the tasklist client when I try to search using variable but when I remove the variable from the task search the request is completed successfully
@Mohamed_Ahmed_Mohame - the error that the shards are down seems like the first path to investigate deeply. This is why I asked about resource usage in Elastic. Are you seeing Elastic max its resources? Are you seeing errors in Elastic?