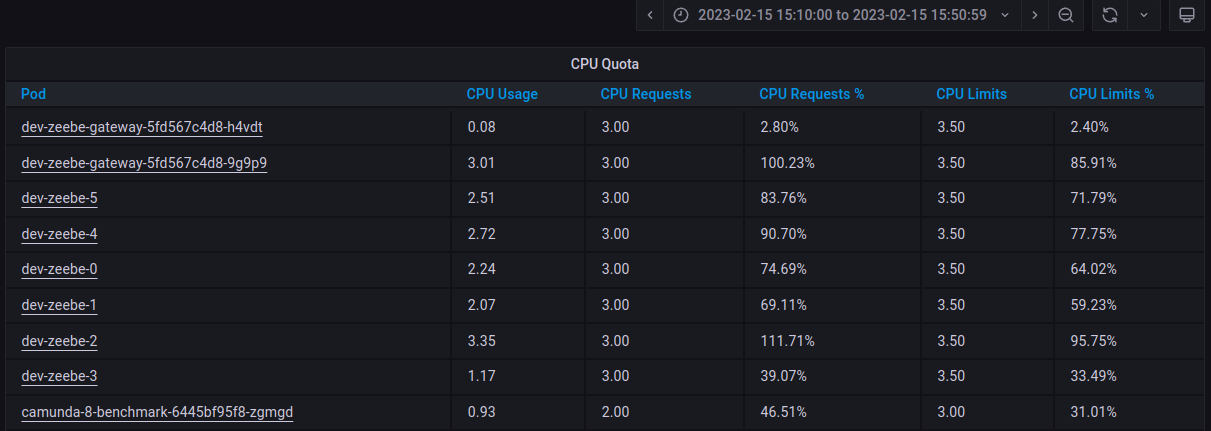
We are load testing zeebe 8.1.6 deployed on k8s through helm charts. With 2 gateways and 6 brokers we found that one gateway pod is overloaded while the cpu usage of another gateway instance is below 3%. Same goes with brokers. There is one broker with 111% usage while another one has only 40% usage. Attached is the screenshot from grafana dashboard
You want to correlate this with the topology of the cluster. Probably you’ll find higher CPU usage on the partition leader.
Also - from memory: depending on how you start the process instances will influence which partition it starts on. Process instances that are started by messages are always started on the same partition.
Right. I see two workarounds to this problem from the github links
Add a load balancer in front of the zeebe-gateways like kong
Enable grpc load balancing on the zeebe-client that triggers the processes.
Will check on this further.
Ok, what is the recommendation for the number of partitions @jwulf ? For e.g. should they be double the number of brokers? Is there some kind of recommendation like this? Related to this would be replicationFactor.
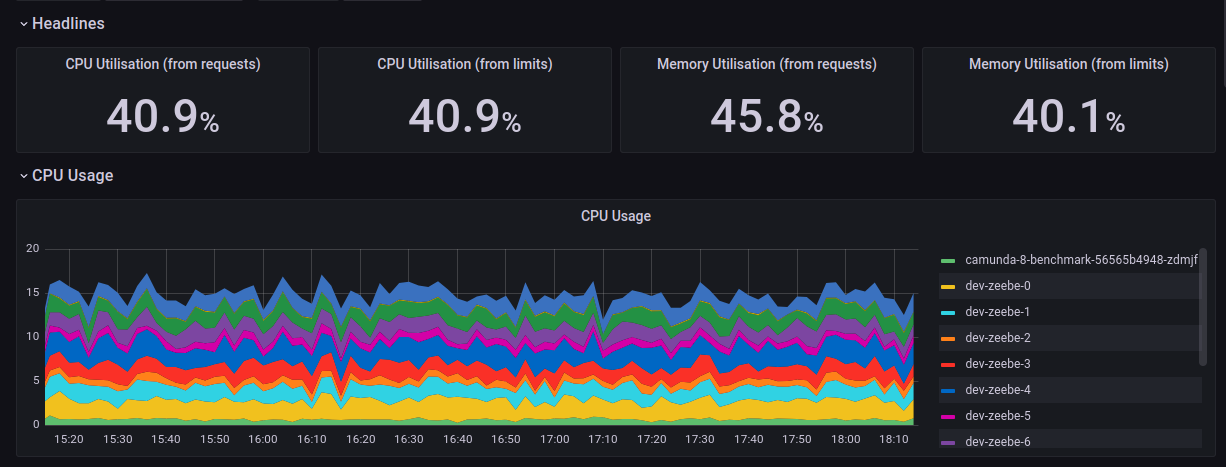
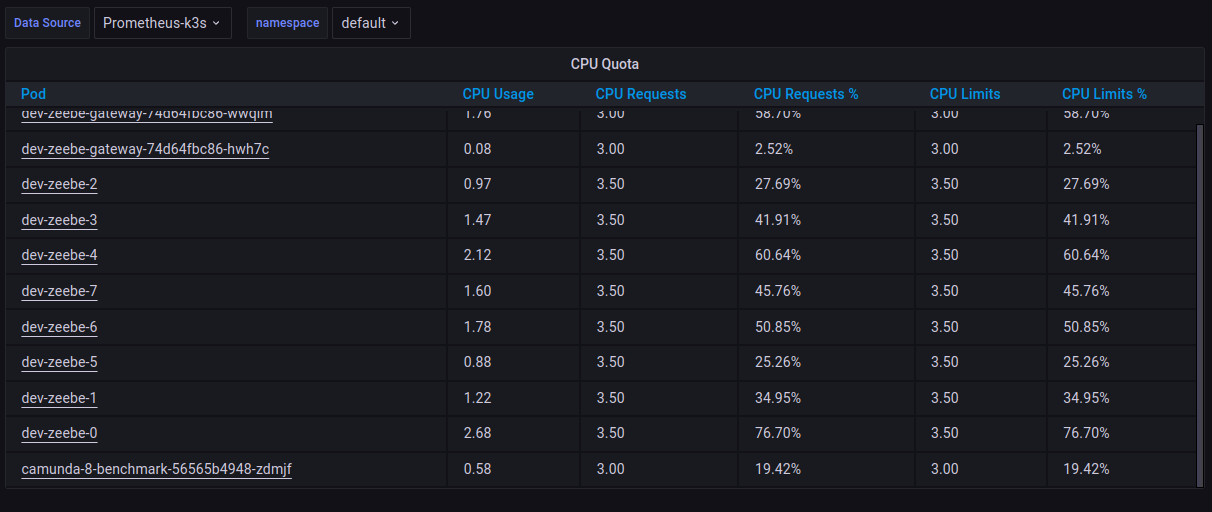
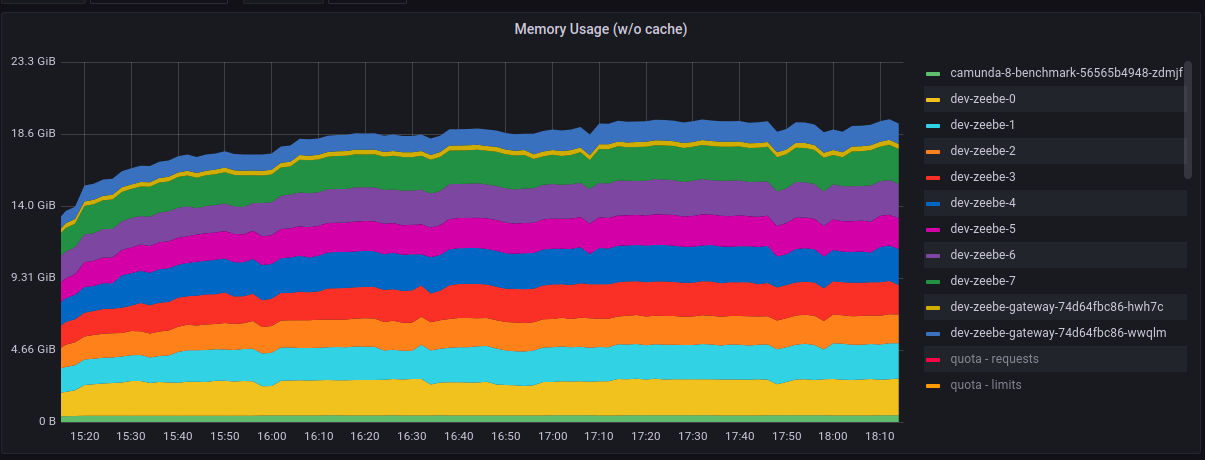
We executed a long-running 3 hour stability test with 8 brokers, 8 partitions and 2 gateways. We again observed under-utilised zeebe brokers. The cpu usage is around 41% and memory usage is around 45%. Below are the grafana screenshots.
If we reduce the brokers to 7 and equal number of partitions we don’t achieve the throughput we desire of 200 PI/s. We get slight backpressure with 7 brokers config.
Could you guide us @Zelldon/@jwulf on what could be tuned to improve the resource usage on the brokers and thereby improve throughput?