We are experimenting with Camunda 8 stack on docker compose and one part is related to process monitoring with Camunda Optimize (3.10.0 in our case for the tests)
One of the report is “User task Count” in which we can choose different filters (like selecting only one of the user task in the process) and grouping.
No here is the problem we face:
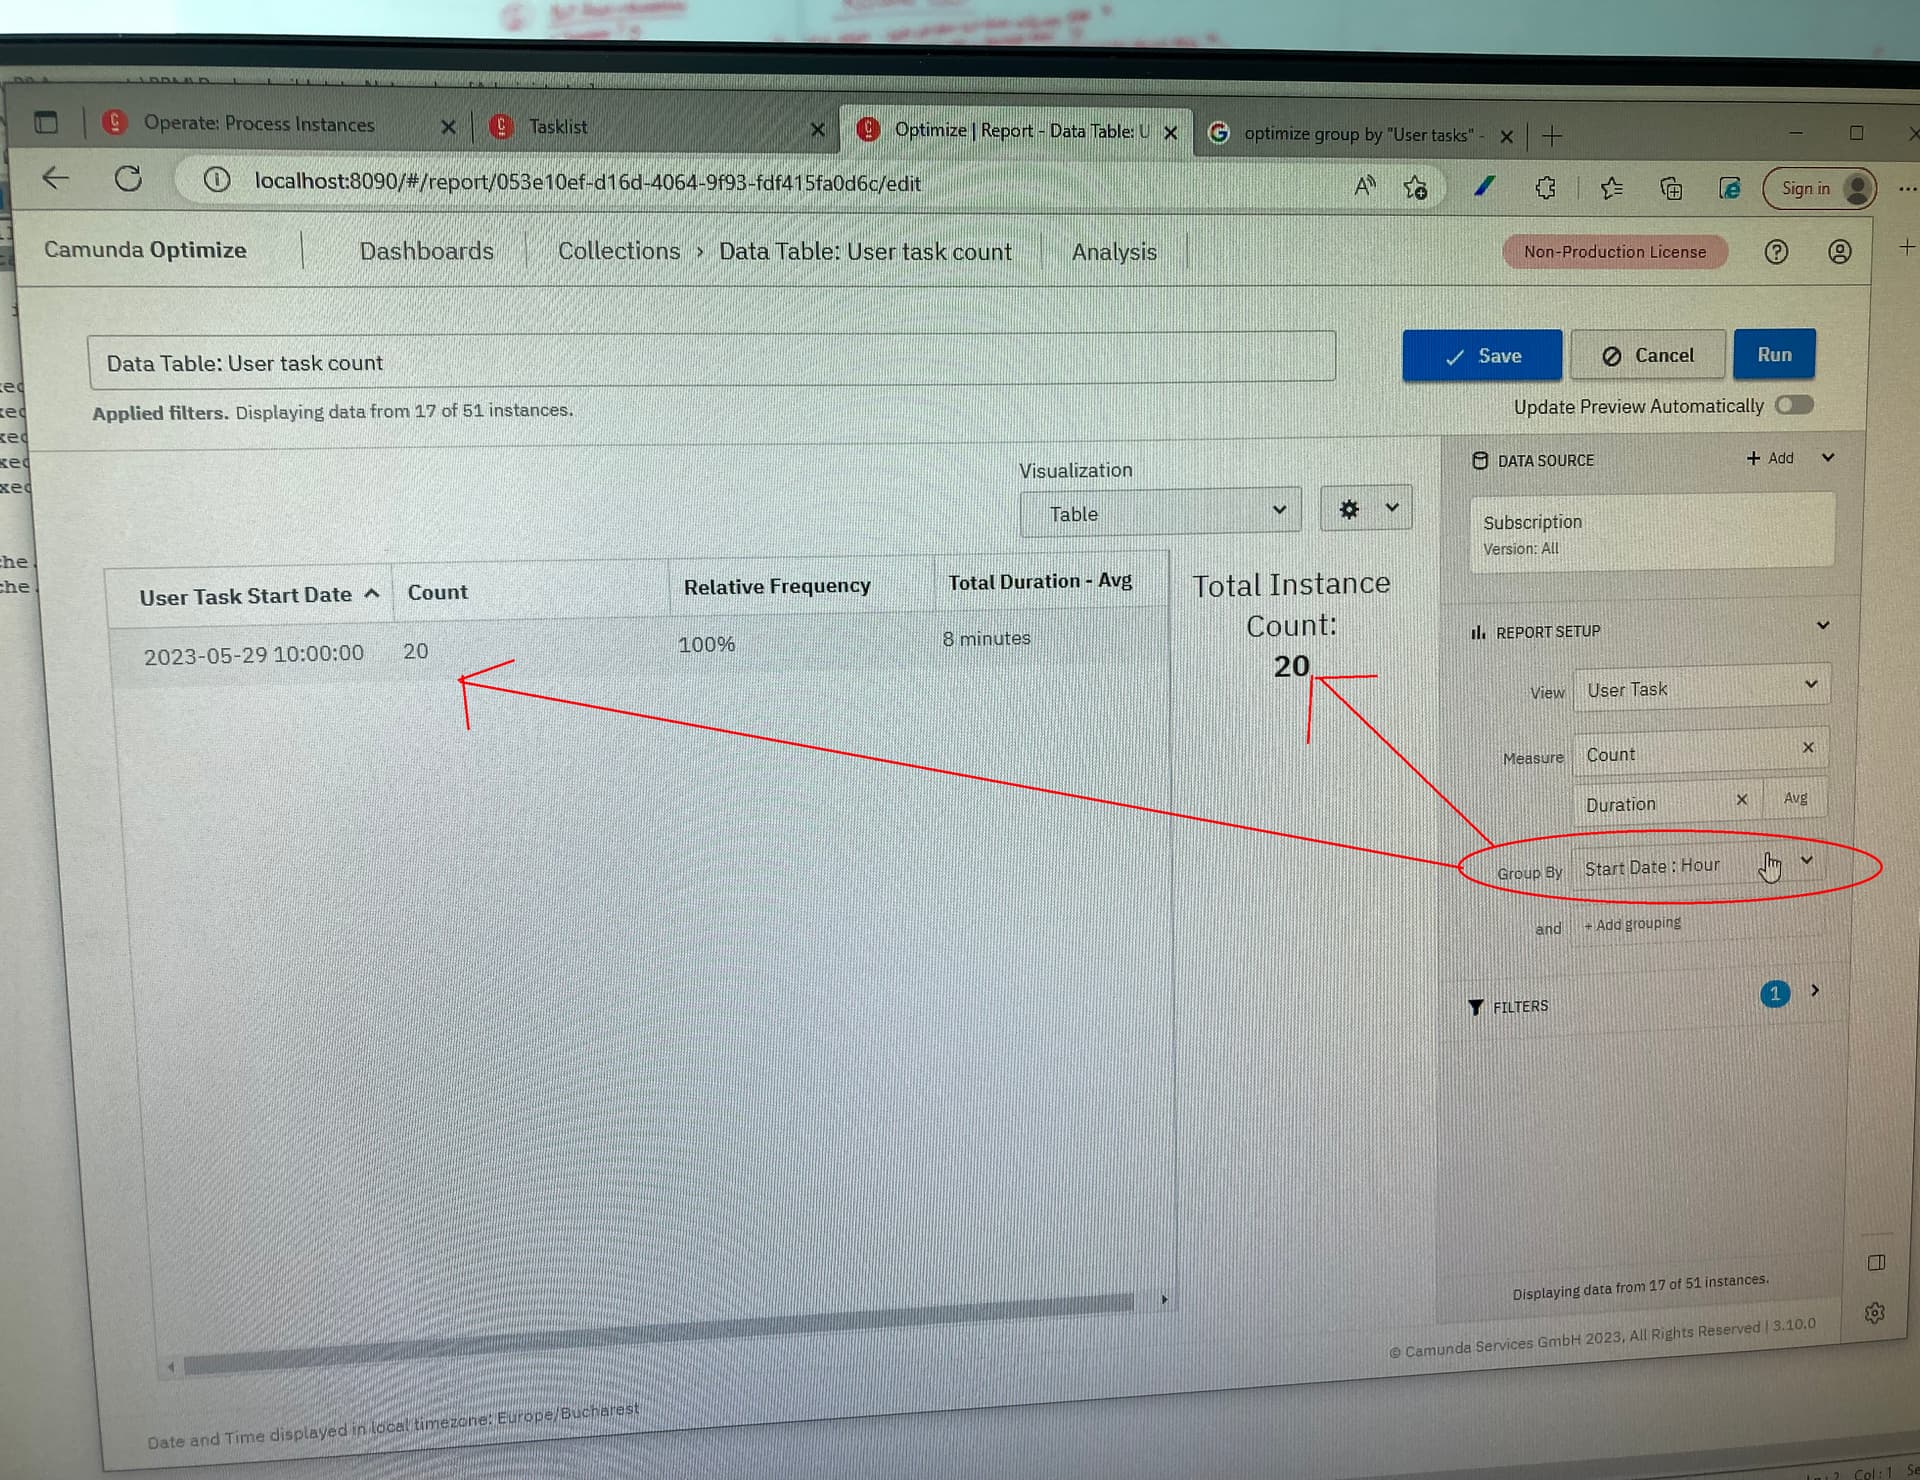
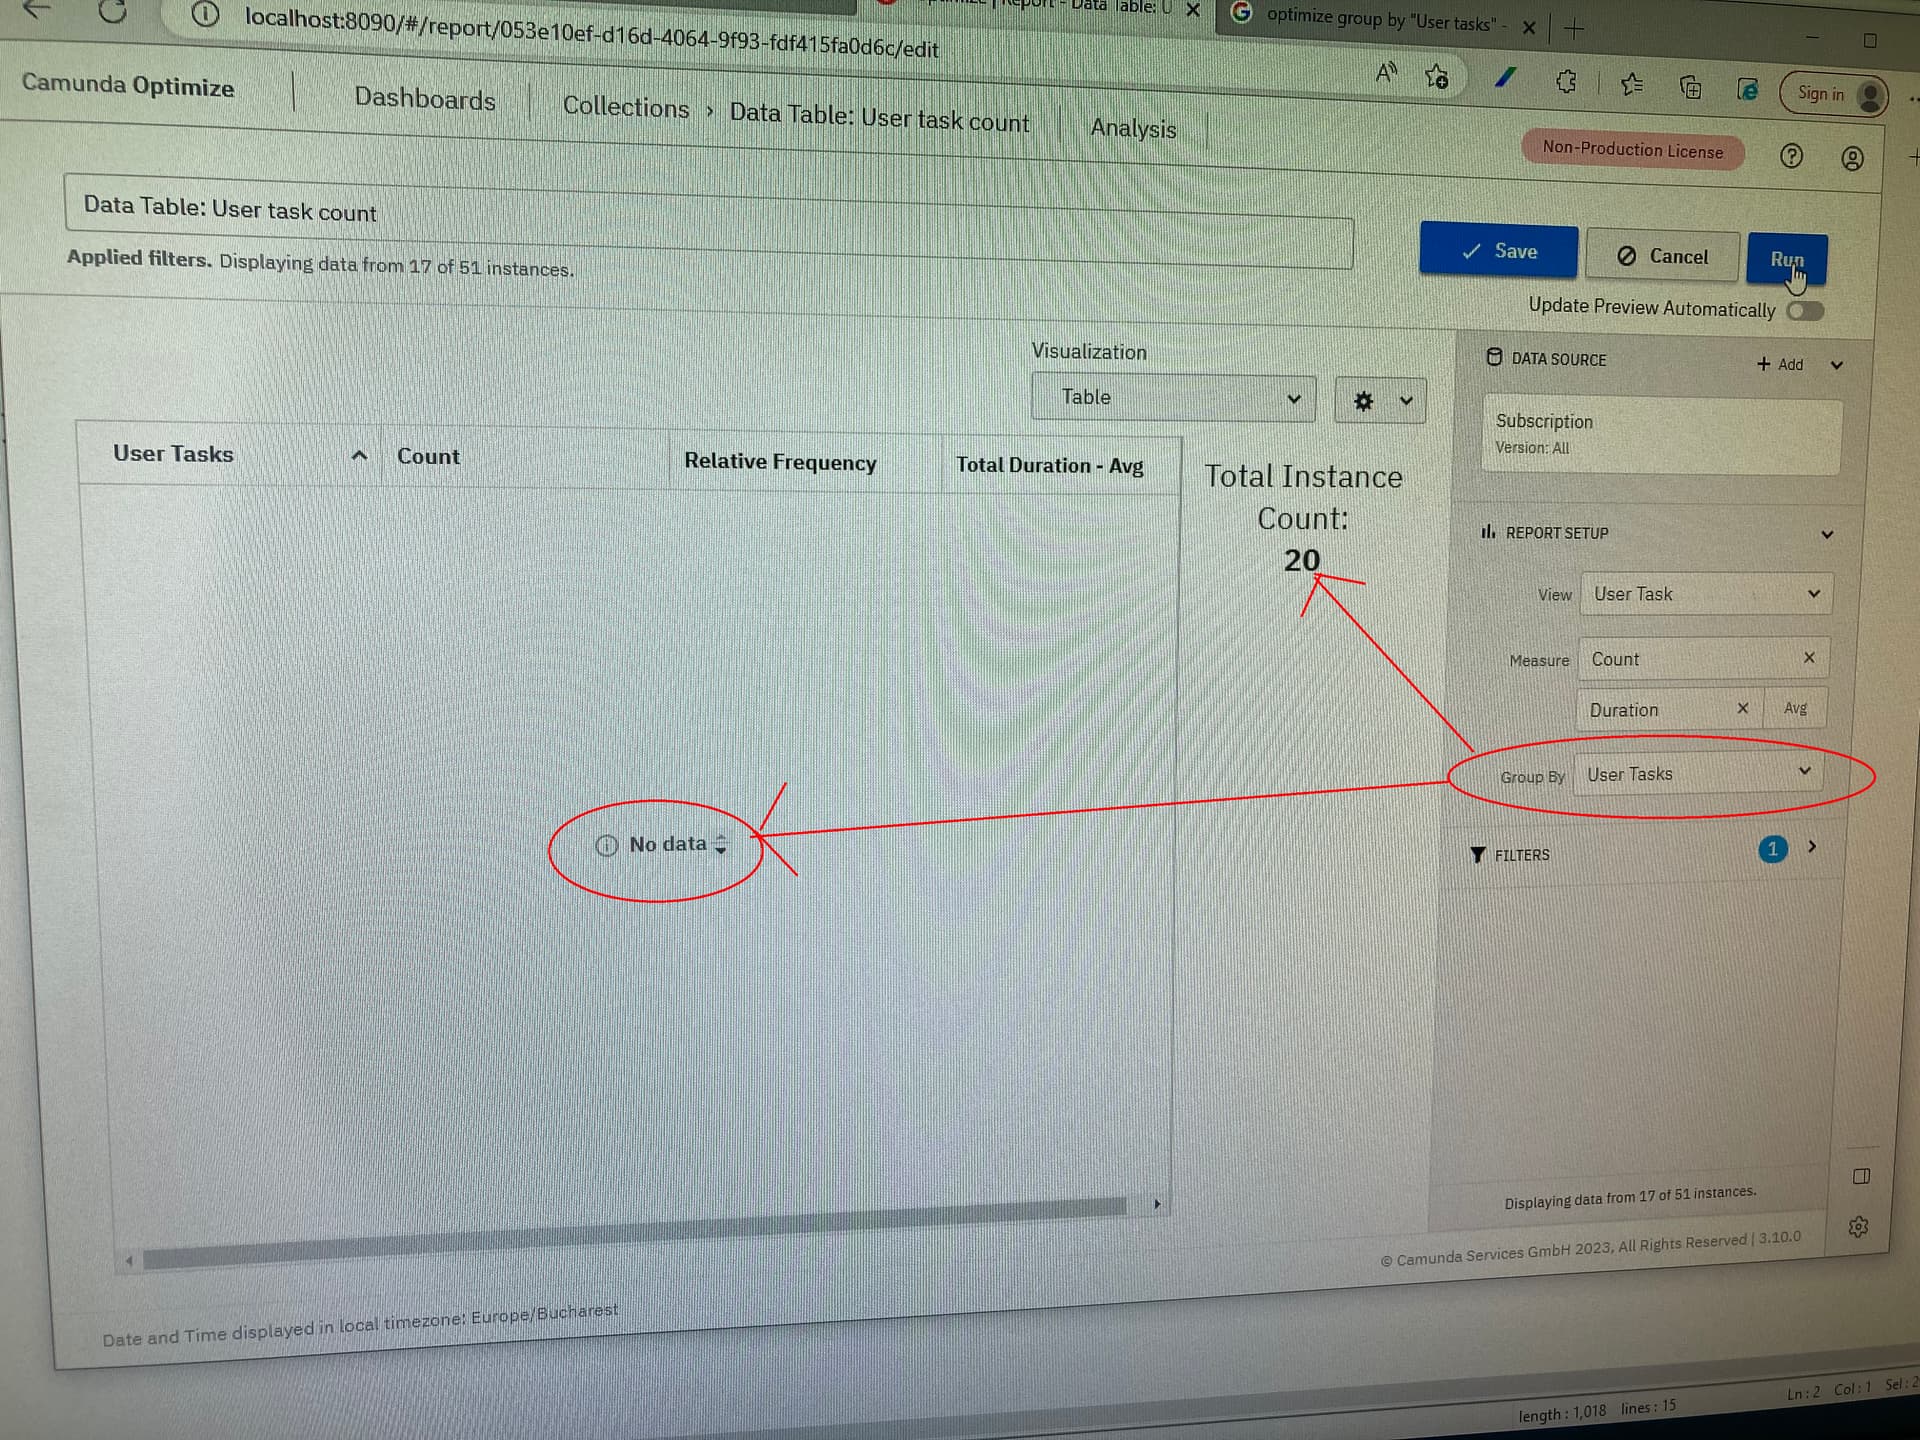
If I group by Start Date the report is rendered ok
If I group by “User task” I expect to see in the table the count on unassigned vs assigned (detailed per user / candidate group). Instead of this we receive “No data”
Hello @Helene,
The filter is on The flow node of the user task in the process (This is why there are 20 instances matching the filter - you can see in both pictures I attached that Total Instance Count = 20, which are the process instances that activated that user task)
Among the 20 instances, some where just started and unassigned, some were just assigned but not finished and some were finished. And what I was expected to see in he report when grouping by “User Task” was exactly this dispatch.
View Group By Second group by
User Task Count, Duration Assignee, Candidate Group User Tasks
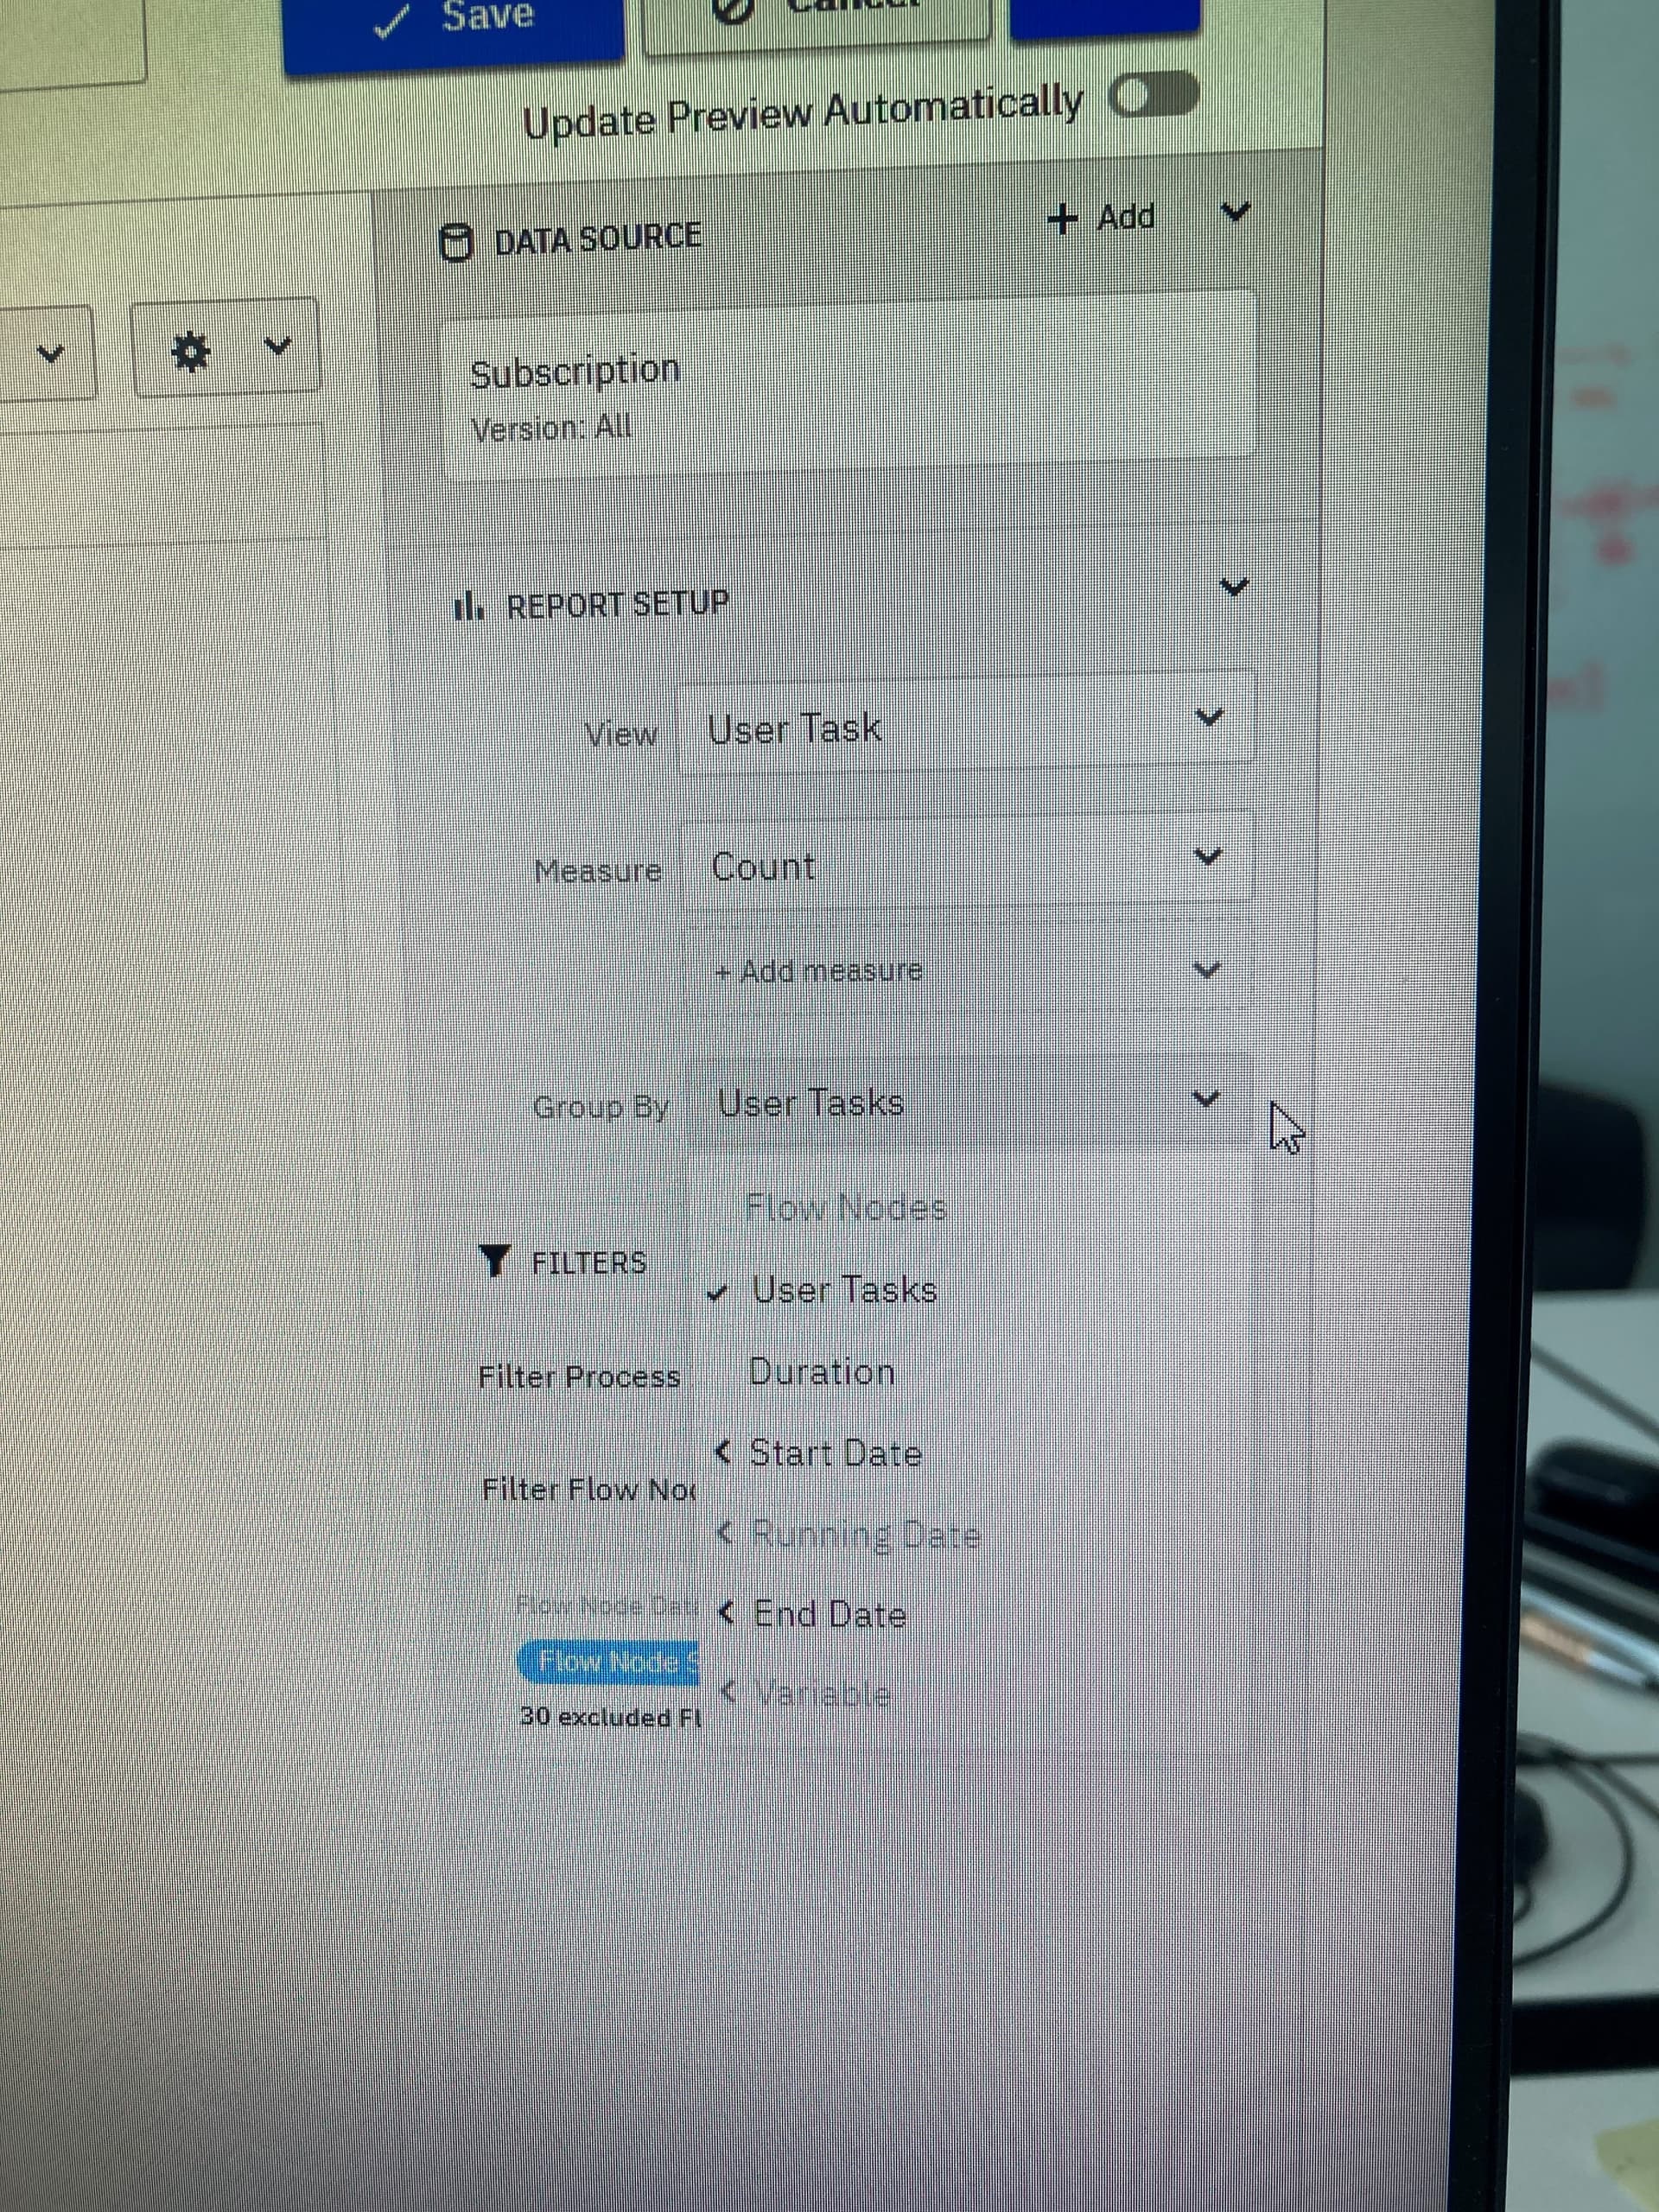
The “Assignee, Candidate Group” is not even available as group by criteria and if I try to use “User Tasks” as a first group criteria I obtain “No data” even if there is a user task in the process (the one I filtered by)
Hi @ionutc,
thanks! There are a couple of filters that let you filter out specific flow nodes only so to make sure I’ve understood your setup correctly can you share a screenshot of the applied filter? Does your report show any data when you remove the filter, and have you tried other visualisations such as the heatmap? Lastly, in the “duration” measure, are you looking for total, work or idle durations (this can be configured by clicking on “avg” in the report setup)?
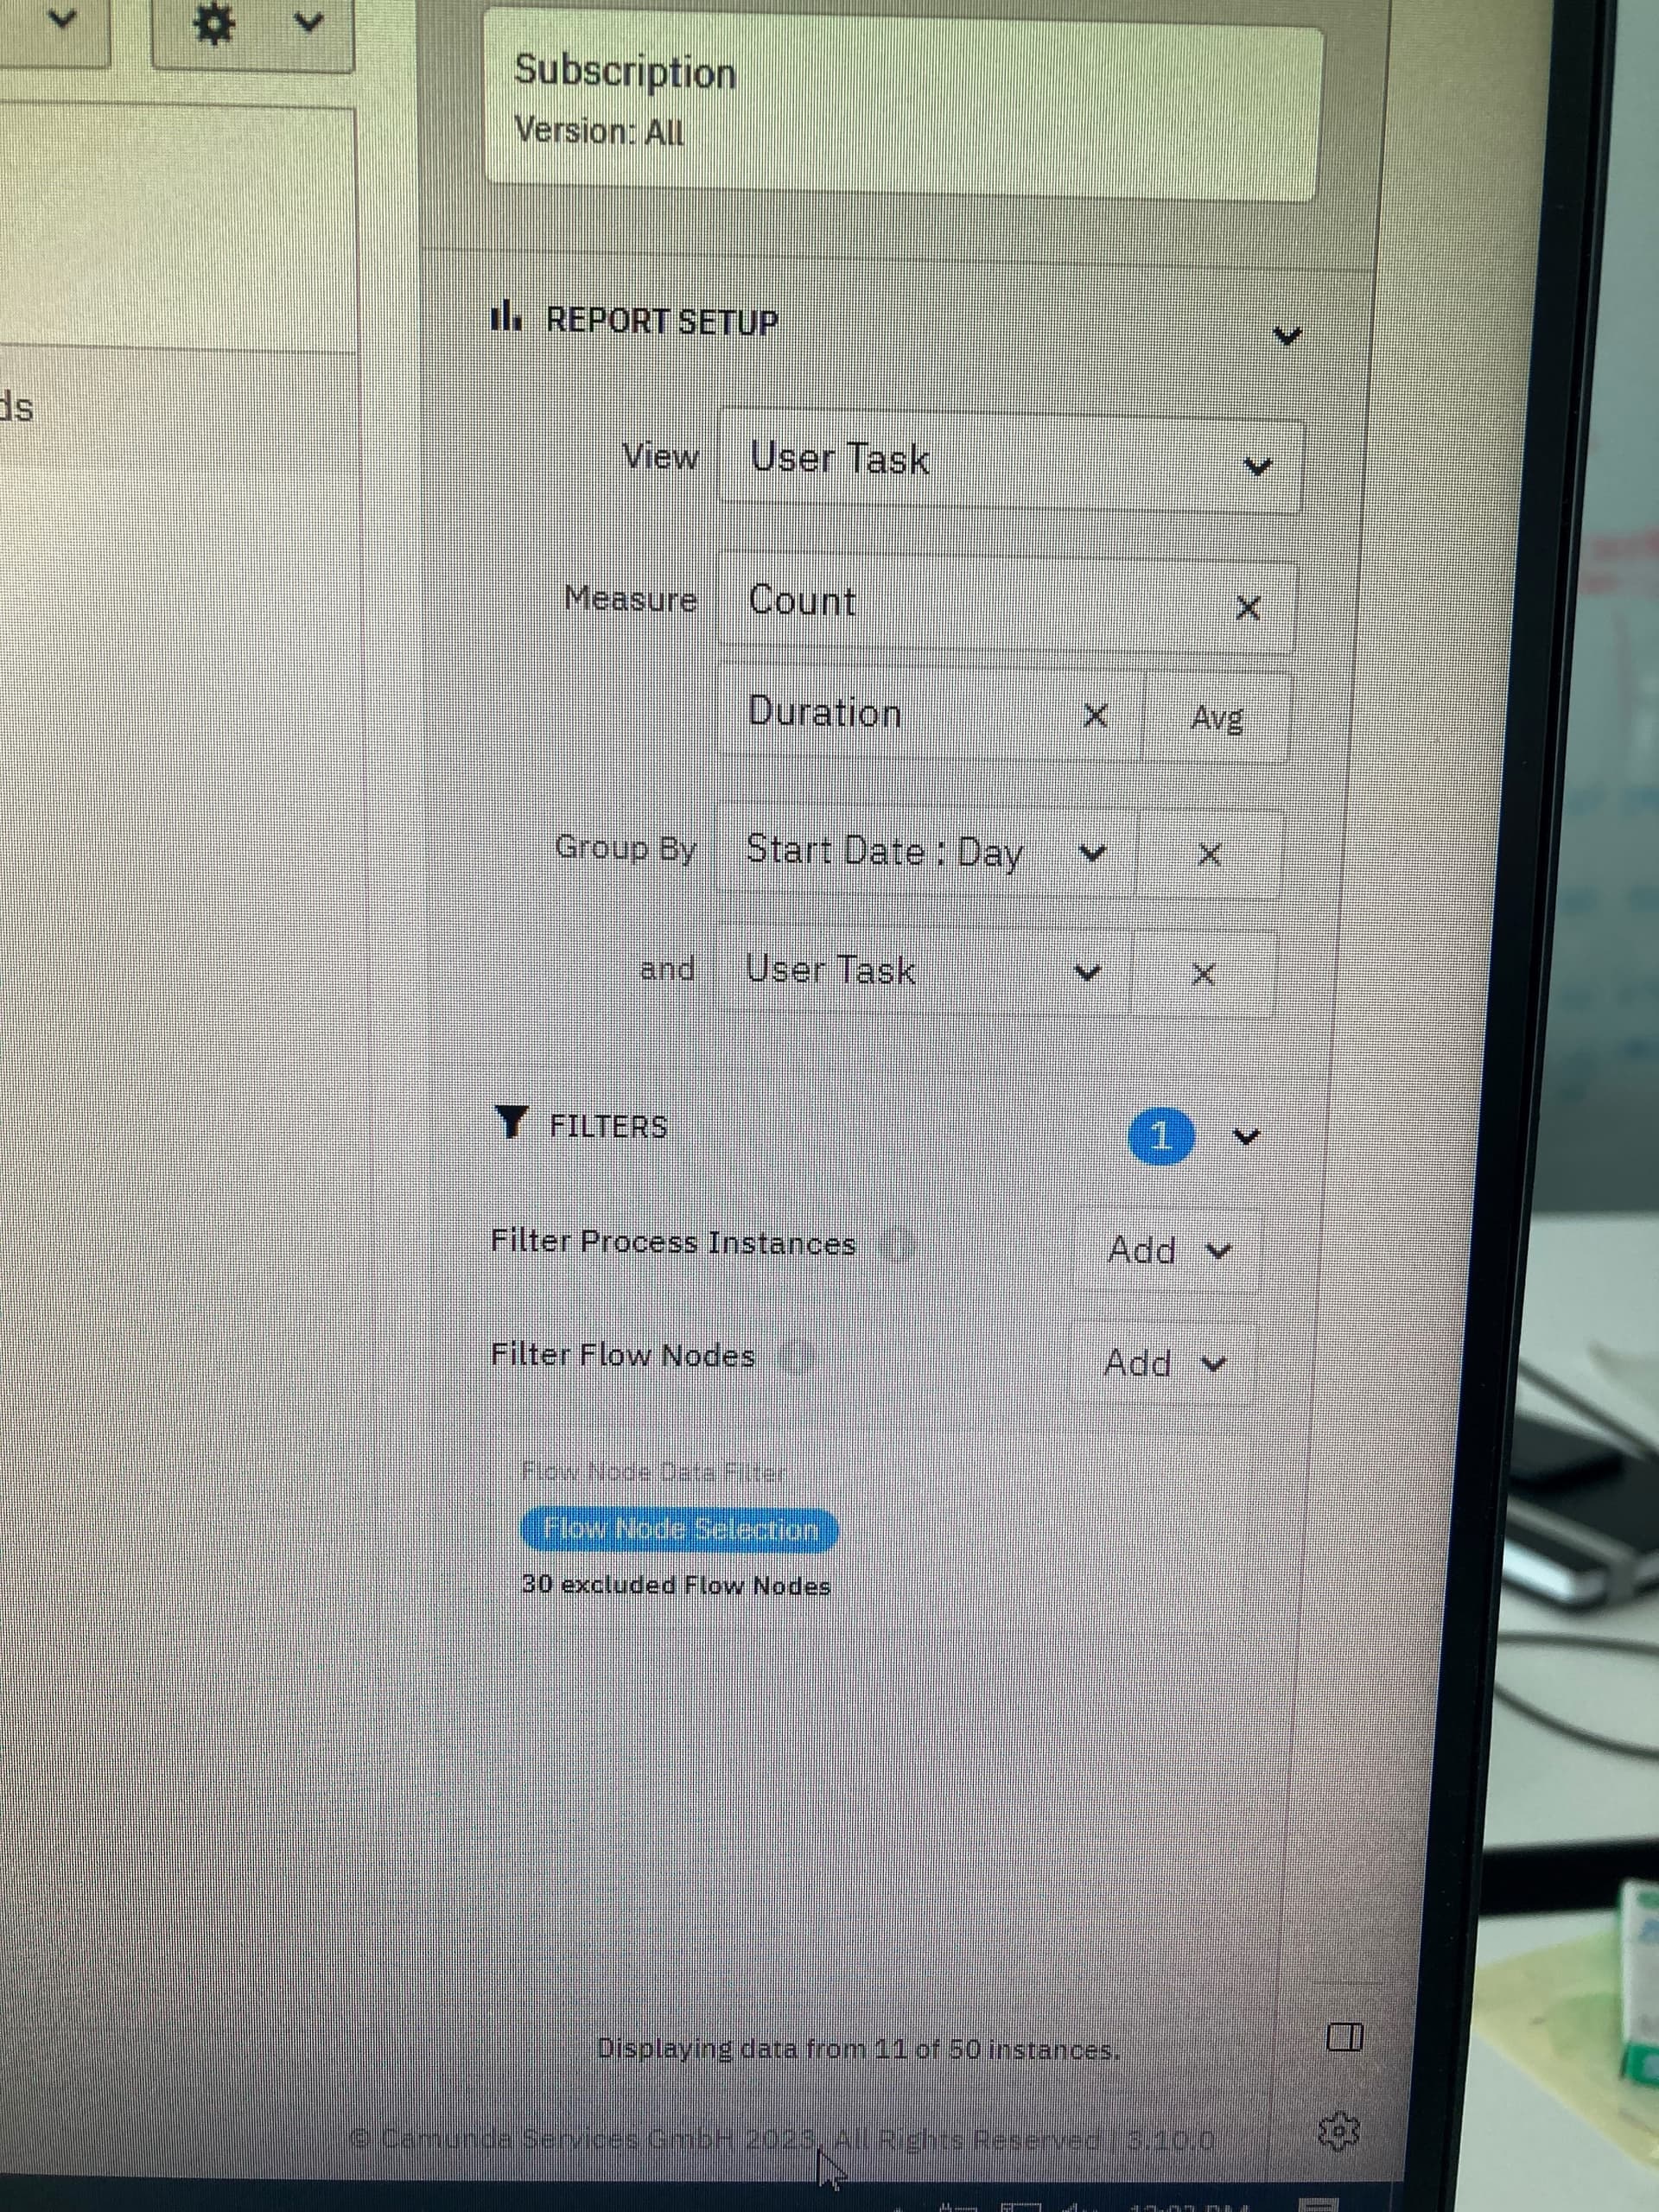
There is no difference if I change the visualization. As long as I have the User Task as a first group by criteria I have no data in the report. If I put start date as “group by” data is shown.
Also I cannot find how to add the “assignee / candidate group” as group by criteria (only user tasks, duration, start date and end date are available as group by)
Hi @ionutc ,
I have recreated your setup and am also struggling to create a user task duration report with this configuration. I am going to check with the team if there are any limitations regarding this feature in C8 and get back to you on that once I know more.
However, I was able to create a flow node duration report which can provide you with an overview of total duration for your user task nodes. To do so you can select the “flow node” view and then the “duration” measure, grouped by flow node. You can also apply a flow node selection filter to only see data from the user task node to this.
For the duration is ok, what I’m more interested in is for the user task to be able to display the report as table showing details for unassigned, assigned to some groups or taken by some users (each with the count and duration measures)
Regarding assignee data:
So, it turns out currently assignee and candidate group data cannot be imported to Optimize in C8 which is why those report options do not yet exist for C8. This also means Usertask duration reports currently do not support work and idle duration calculations in C8. I will forward your interest for us to take into account when prioritising features for future releases.
As a workaround, you could consider storing assignee names in a string variable instead and then using a flownode duration/count report grouped by that variable instead to visualise the data.
Regarding usertask duration (and count reports):
It should be possible to create usertask count and duration reports and it appears this is not possible for Optimize C8. I have created a bug ticket for us to look into. Until we’ve found and implemented a fix for this you can use the flownode reports with a flownode selection filter though, this should yield the same data.
Ok, I’m waiting for the news than regarding the bug and also for the assignee / candidate group (maybe for this it would be good to mark it in the documentation as a Camunda 7 only feature up until it will be available in C8 as well).
PS Regarding the bug on User Task group by, take a look also at the KPI’s reports because I noticed that on the prebuild dashboard in Optimize 3.10, the pie chart with Automation Candidates is empty as well (and i think this one takes the data from User Tasks as well).
Thanks, I’ve also noted adjusting the docs in our ticket system. I’ve checked and you’re right, the Automation Cnadidate report also seems to be a user task report so its probably the same issue causing there to be no data in this part of the prebuilt dashboard and should be addressed with the same fix