Rafael Pili: Hello! I’m implementing zeebe workers with the spring library in an k8s enviroment. I’m currently stressing the application, with 50VUs, and I configured the HPA. What I noticed, is that even though new pods are being created to support the load, the broker keeps sending more requests to the initial pods (Their CPU load stays much higher than all others). Is this expected behavior? Should I have less replicas of workers but with more resources?
Rafael Pili: Hello! I’m implementing zeebe workers with the spring library in an k8s enviroment. I’m currently stressing the application, with 50VUs, and I configured the HPA. What I noticed, is that even though new pods are being created to support the load, the broker keeps sending more requests to the initial pods (Their CPU load stays much higher than all others). Is this expected behavior? Should I have less replicas of workers but with more resources?
Rafael Pili: my worker configurations: long-pool 5min, maxActiveJobs 20, poll interval 1ms
Rafael Pili: also, I 'm getting really high response times for a fairly small load. The workflow only has two steps which take together 50ms to complete, however, I’m getting response times in 900ms marks…
Rafael Pili: I can atest for the step execution time, since I’m logging them during execution
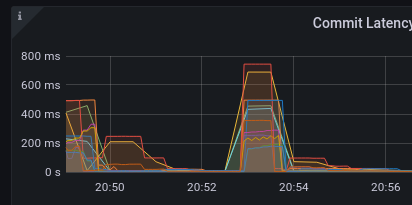
Rafael Pili: commit latency during testing
Rafael Pili: broker config
resources:
  requests:
    cpu: 5
    memory: 512Mi
  limits:
    cpu: 5
    memory: 512Mi
Rafael Pili: zeebe version 8.0.3
zell: Hey <@U03MFKTCSN5>
could you please share a bit more information on the configuration you’re running?
What type of disk? Size of disk?
Which cloud provider? gke?
How many partitions?
How many nodes?
In general yes it is wise to have less workers, since this can overload the system as well (due to polling mechanism) of course depends on the worker config.
Rafael Pili: hi! I’m using SSD 32Gb for each node, Cloud Provider aws. On this test I was using 3 partitions, I increased to 48 and got much better results, now witth the response time ranging to 500ms. I’m using 3 nodes
Rafael Pili: what is boggling me the most is that I’m getting very high latencies for a small workload. With 2VUs I’m getting an average of 350ms in response time, however the workflow only has 2 steps which take combined more or less 50ms, so zeebe is adding almost 200ms of latency for only 2 VUs, Why is that?
Rafael Pili: I would be really glad if u could help me @zell ![]()
Rafael Pili:
zell: Sorry @Rafael Pili for the late response.
• What is meant by 50VUs?
• How many process instances are you running per second?
• How many should be completed per second?
• How many jobs? How many different job types?
Unfortunately, I have no experience with aws, but on GKE (where we run our benchmarks) the disk size and CPU count <Configure disks to meet performance requirements | Compute Engine Documentation | Google Cloud used to determine the disk throughput>. Might make sense to increase the disk size in your case as well. Or check whether Zeebe is io throttled.
Did you thought about increase your zeebe cluster to 5 or 7 nodes? to better distribute the partitions?
I guess you use the helm charts?
Rafael Pili: thanks, I will try that. My process only has 2 quick jobs, with no replication. I tried using the disable flush experimental flag, and got much better response times. However, there is a lot of instability, like, the response times are ranging between 70ms-200ms.
50VUs, would be like threads in JMeter, but i’m using k6. That is now getting me a TP of 7k rpm
Rafael Pili: I will try now with 64Gi and 5 nodes, let’s see
zell: > with no replication
Do you mean zeebe without replication? Or no additional workers?
Interesting so you referring to that https://k6.io/docs/using-k6/scenarios/executors/per-vu-iterations/ right? How does your test application look like?
Rafael Pili: Hi, zell, exactly! I mean I was using the following config in my last tests: 3 nodes, 48 partitions and replication factor 1
zell: I think this is related to https://github.com/camunda/zeebe/issues/8132 where we see some issues with the commit latency with no replication
Rafael Pili: yes! it’s probably related, since disabling flush got me absurdly better results
Rafael Pili: i wanted to thank you <@U6WCLLNGJ>, i finally got 10.6k troughput with 128ms of response time following your tips. It was really important to get this response time, thanks!
zell: Awesome! Thats great to hear @Rafael Pili thanks for the feedback ![]()
zell: Do you mind to share your end configuration for posterity ? ![]()
Rafael Pili: sure! just a sec
Note: This post was generated by Slack Archivist from a conversation in the Camunda Platform 8 Slack, a source of valuable discussions on Camunda 8 (get an invite). Someone in the Slack thought this was worth sharing!
If this post answered a question for you, hit the Like button - we use that to assess which posts to put into docs.