We have a cluster of 3 Zeebe brokers v8.0.2 with 2 Zeebe Gateways in front of them. The brokers are configured with 3 partitions and 3 replicas. we monitor the cluster using the Grafana dashboard provided by Camunda.
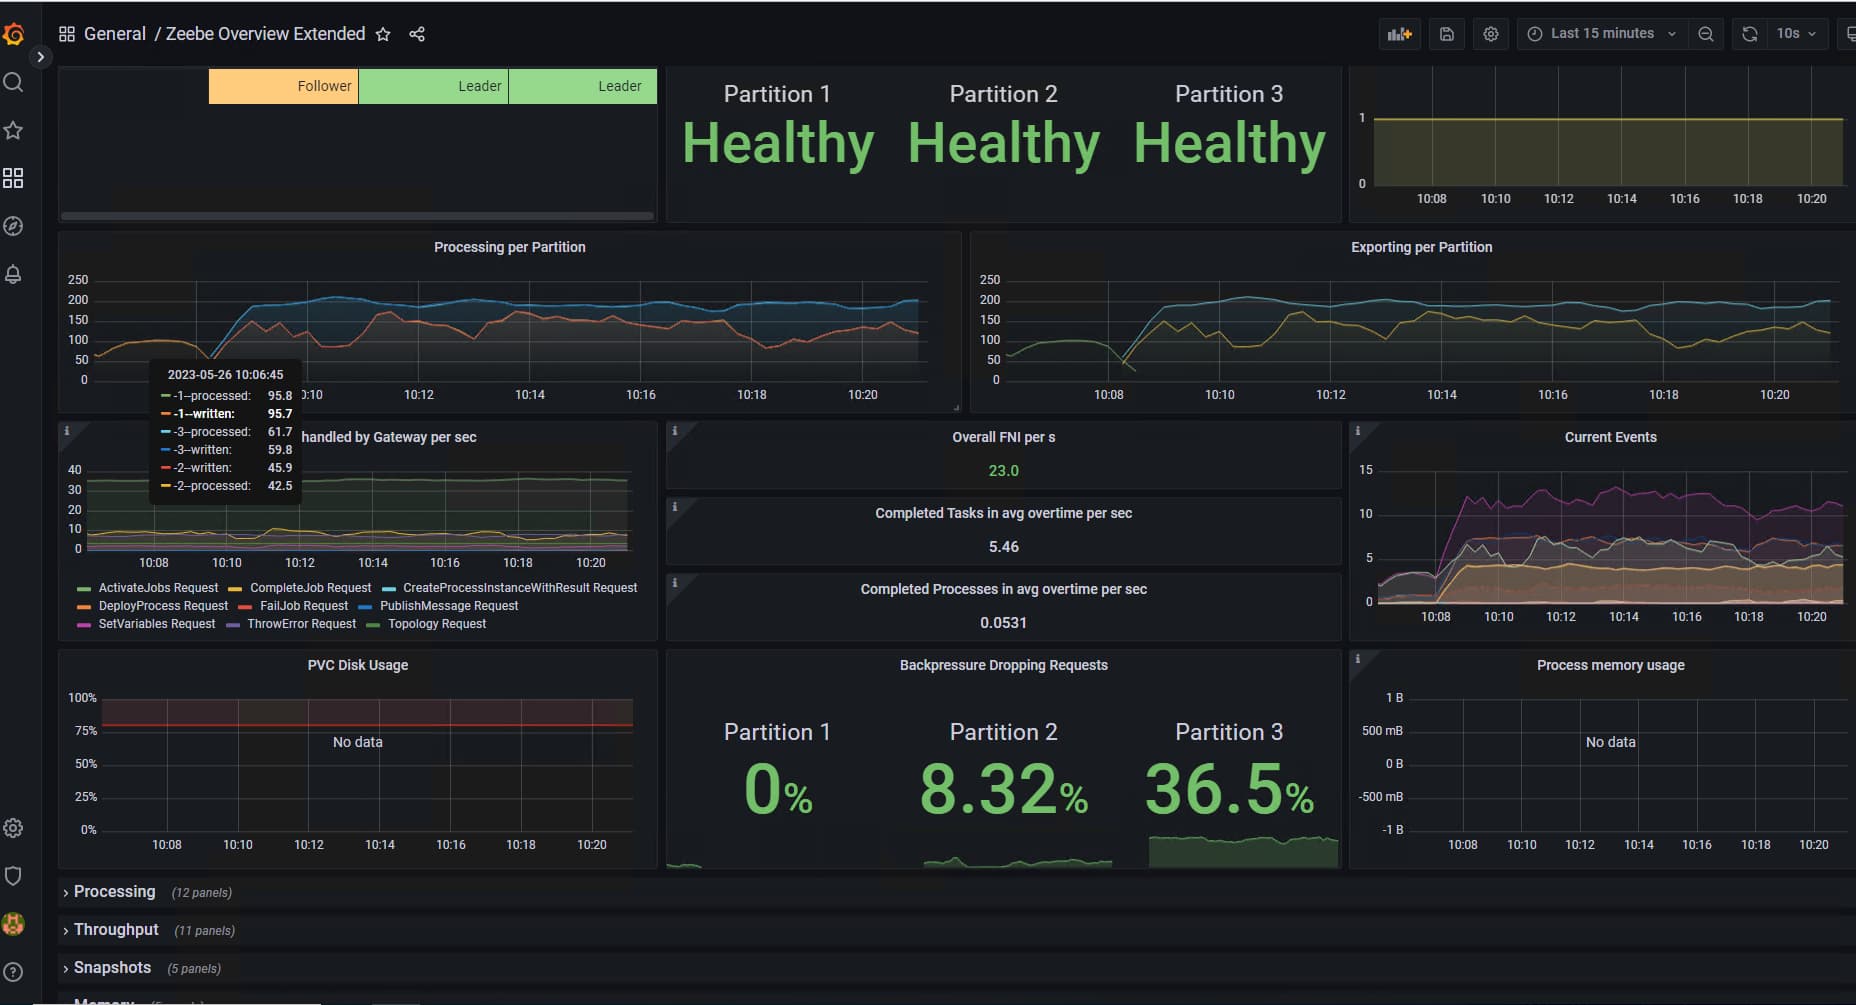
Every thing seems fine until one or two weeks of worflows running. At some point we can see that one of the three partition is having backpressure Dropping requests as follow:
When we are such a situation, the workflows are slower than before. We want to understand why only one partition is saturated and what can we do solve it.
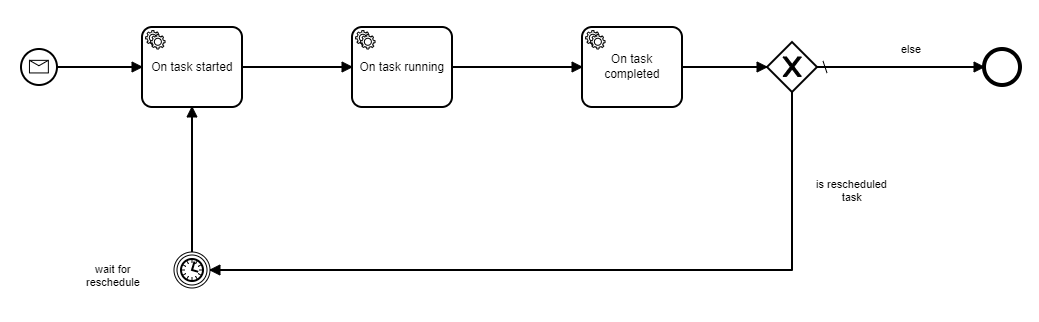
The instances are started on reception of a message. Some instances will always be scheduled to run on a timely bases every two hours and will never be as Completed. Please just have a look to the figure below for a clearer understanding.
Not sure if this has changed, but previously, the message start event subscription for a process model is opened on a specific partition. So if you are just starting that one process instance via messages, they will all start on the same partition.