Hello @Zelldon , I’ll try to answer your questions, @vasyl probably will add later regarding the workers and clients
8.0.5 zeebe version, Java 17 client for workers
Cluster deployed to k8s on bare metal ( VM’s in the local data center)
Currently we have 5 zeebe brokers and 1 standalone gateway in the cluster
We use hazelcast exporter to the external HZ cluster and simple-monitor. It doesn’t work, but it is another problem anyway
The type of disks is SSD and they should be reasonably fast.
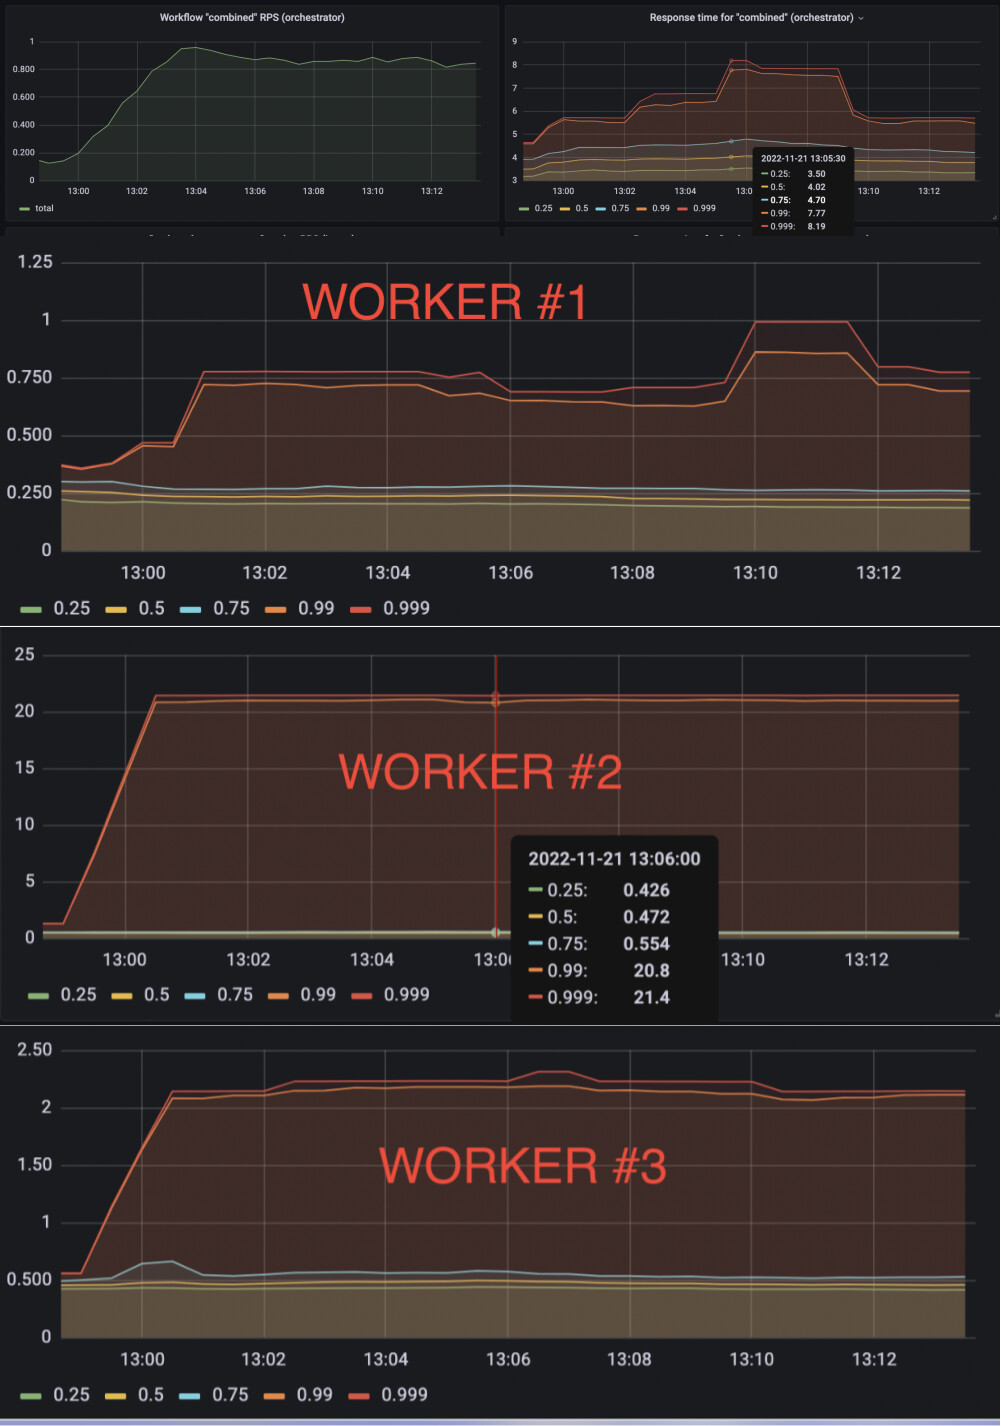
Regarding metrics - we have metrics collected by Prometheus and showing in Grafana. Actually, there are dozens of them and I can not see any signs of slow processing. We can share any dashboards if it helps.
Broker configuration
{
  "network" : {
    "host" : "0.0.0.0",
    "portOffset" : 0,
    "maxMessageSize" : "4MB",
    "advertisedHost" : "zb-zeebe-0.zb-zeebe.dev.svc.cluster.local",
    "commandApi" : {
      "host" : "0.0.0.0",
      "port" : 26501,
      "advertisedHost" : "zb-zeebe-0.zb-zeebe.dev.svc.cluster.local",
      "advertisedPort" : 26501,
      "address" : "0.0.0.0:26501",
      "advertisedAddress" : "zb-zeebe-0.zb-zeebe.dev.svc.cluster.local:26501"
    },
    "internalApi" : {
      "host" : "0.0.0.0",
      "port" : 26502,
      "advertisedHost" : "zb-zeebe-0.zb-zeebe.dev.svc.cluster.local",
      "advertisedPort" : 26502,
      "address" : "0.0.0.0:26502",
      "advertisedAddress" : "zb-zeebe-0.zb-zeebe.dev.svc.cluster.local:26502"
    },
    "security" : {
      "enabled" : false,
      "certificateChainPath" : null,
      "privateKeyPath" : null
    },
    "maxMessageSizeInBytes" : 4194304
  },
  "cluster" : {
    "initialContactPoints" : [ "zb-zeebe-0.zb-zeebe.dev.svc.cluster.local:26502", "zb-zeebe-1.zb-zeebe.dev.svc.cluster.local:26502", "zb-zeebe-2.zb-zeebe.dev.svc.cluster.local:26502", "zb-zeebe-3.zb-zeebe.dev.svc.cluster.local:26502", "zb-zeebe-4.zb-zeebe.dev.svc.cluster.local:26502" ],
    "partitionIds" : [ 1, 2, 3, 4, 5, 6, 7, 8, 9, 10 ],
    "nodeId" : 0,
    "partitionsCount" : 8,
    "replicationFactor" : 2,
    "clusterSize" : 5,
    "clusterName" : "zb-zeebe",
    "heartbeatInterval" : "PT0.25S",
    "electionTimeout" : "PT2.5S",
    "membership" : {
      "broadcastUpdates" : false,
      "broadcastDisputes" : true,
      "notifySuspect" : false,
      "gossipInterval" : "PT0.25S",
      "gossipFanout" : 2,
      "probeInterval" : "PT1S",
      "probeTimeout" : "PT0.1S",
      "suspectProbes" : 3,
      "failureTimeout" : "PT10S",
      "syncInterval" : "PT10S"
    },
    "raft" : {
      "enablePriorityElection" : true
    },
    "messageCompression" : "NONE"
  },
  "threads" : {
    "cpuThreadCount" : 8,
    "ioThreadCount" : 8
  },
  "data" : {
    "directory" : "/usr/local/zeebe/data",
    "logSegmentSize" : "128MB",
    "snapshotPeriod" : "PT5M",
    "logIndexDensity" : 100,
    "diskUsageMonitoringEnabled" : true,
    "diskUsageReplicationWatermark" : 0.99,
    "diskUsageCommandWatermark" : 0.97,
    "diskUsageMonitoringInterval" : "PT1S",
    "logSegmentSizeInBytes" : 134217728,
    "freeDiskSpaceCommandWatermark" : 61399204,
    "freeDiskSpaceReplicationWatermark" : 20466401
  },
  "exporters" : {
    "hazelcast" : {
      "jarPath" : "/usr/local/zeebe/exporters/zeebe-hazelcast-exporter-jar-with-dependencies.jar",
      "className" : "io.zeebe.hazelcast.exporter.HazelcastExporter",
      "args" : {
        "clusterName" : "dev",
        "name" : "zeebe-dev",
        "remoteAddress" : "hz-hazelcast.test:5701",
        "remoteConnectionTimeout" : "PT30S"
      },
      "external" : true
    }
  },
  "gateway" : {
    "network" : {
      "host" : "0.0.0.0",
      "port" : 26500,
      "minKeepAliveInterval" : "PT30S"
    },
    "cluster" : {
      "contactPoint" : "0.0.0.0:26502",
      "requestTimeout" : "PT15S",
      "clusterName" : "zeebe-cluster",
      "memberId" : "gateway",
      "host" : "0.0.0.0",
      "port" : 26502,
      "membership" : {
        "broadcastUpdates" : false,
        "broadcastDisputes" : true,
        "notifySuspect" : false,
        "gossipInterval" : "PT0.25S",
        "gossipFanout" : 2,
        "probeInterval" : "PT1S",
        "probeTimeout" : "PT0.1S",
        "suspectProbes" : 3,
        "failureTimeout" : "PT10S",
        "syncInterval" : "PT10S"
      },
      "security" : {
        "enabled" : false,
        "certificateChainPath" : null,
        "privateKeyPath" : null
      },
      "messageCompression" : "NONE"
    },
    "threads" : {
      "managementThreads" : 1
    },
    "security" : {
      "enabled" : false,
      "certificateChainPath" : null,
      "privateKeyPath" : null
    },
    "longPolling" : {
      "enabled" : true
    },
    "interceptors" : [ ],
    "initialized" : true,
    "enable" : false
  },
  "backpressure" : {
    "enabled" : true,
    "algorithm" : "VEGAS",
    "aimd" : {
      "requestTimeout" : "PT1S",
      "initialLimit" : 100,
      "minLimit" : 1,
      "maxLimit" : 1000,
      "backoffRatio" : 0.9
    },
    "fixed" : {
      "limit" : 20
    },
    "vegas" : {
      "alpha" : 3,
      "beta" : 6,
      "initialLimit" : 20
    },
    "gradient" : {
      "minLimit" : 10,
      "initialLimit" : 20,
      "rttTolerance" : 2.0
    },
    "gradient2" : {
      "minLimit" : 10,
      "initialLimit" : 20,
      "rttTolerance" : 2.0,
      "longWindow" : 600
    }
  },
  "experimental" : {
    "maxAppendsPerFollower" : 2,
    "maxAppendBatchSize" : "32KB",
    "disableExplicitRaftFlush" : false,
    "rocksdb" : {
      "columnFamilyOptions" : { },
      "enableStatistics" : false,
      "memoryLimit" : "512MB",
      "maxOpenFiles" : -1,
      "maxWriteBufferNumber" : 6,
      "minWriteBufferNumberToMerge" : 3,
      "ioRateBytesPerSecond" : 0,
      "disableWal" : true
    },
    "raft" : {
      "requestTimeout" : "PT5S",
      "maxQuorumResponseTimeout" : "PT0S",
      "minStepDownFailureCount" : 3,
      "preferSnapshotReplicationThreshold" : 100,
      "preallocateSegmentFiles" : true
    },
    "partitioning" : {
      "scheme" : "ROUND_ROBIN",
      "fixed" : [ ]
    },
    "queryApi" : {
      "enabled" : false
    },
    "consistencyChecks" : {
      "enablePreconditions" : false,
      "enableForeignKeyChecks" : false,
      "settings" : {
        "enablePreconditions" : false,
        "enableForeignKeyChecks" : false
      }
    },
    "features" : {
      "enableYieldingDueDateChecker" : false
    },
    "maxAppendBatchSizeInBytes" : 32768
  },
  "executionMetricsExporterEnabled" : false
}```