Hello everyone, I am started to use Zeebe a few months ago with the following configuration:
- a cluster with 3 nodes
- an elasticsearch instance
- 2 gateways
- Camunda operate
- Prometheus instance.
The problem I am having is I have configured the monitoringApi and port 9600 in the application.yaml for camunda operate-deployment and zeebe-configmap and still cannot scrapping from the operate-url:9600/metrics.
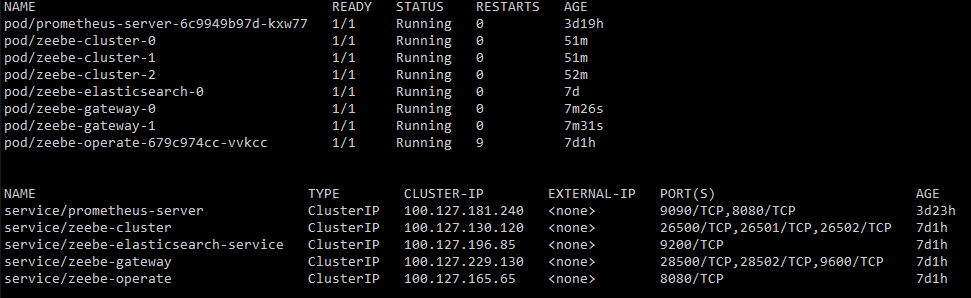
My question so far is, is it correct where I am putting the configuration? Should I consider a networking rule to allow communication between pods? I attach a screenshot of my configuration for further details: