Hi
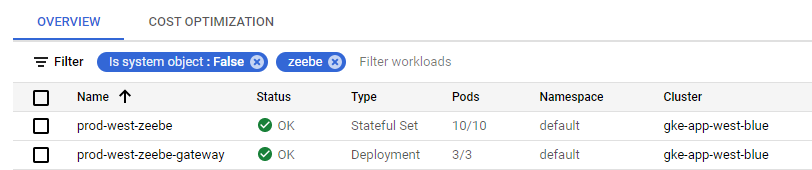
We have deployed Zeebe on GCP using helm charts. Attached Image shows the workloads deployed through Helm.
For monitoring purpose, we are using the prebuilt Grafana Dashboard provided in the camunda docs ( monitor/grafana/zeebe.json)
In prometheus we have configured the service end points of zeebe and zeebe-gateway to get the metrics. But we see that some of the charts are empty.
When I checked the queries configured for those charts, i see that those queries are not present in prometheus. Below are the list of queries which are not found in prometheus. Is it because those queries have no data or am I missing some config because of which those metrics are not being shown?
zeebe_exporter_events_total
grpc_server_handled_total
kubelet_volume_stats_used_bytes
kubelet_volume_stats_capacity_bytes
container_memory_rss
kube_pod_container_resource_limits_memory_bytes
kube_pod_container_resource_requests_memory_bytes
zeebe_exporter_last_exported_position
zeebe_exporter_last_updated_exported_position
zeebe_snapshot_replication_duration_milliseconds
zeebe_snapshot_replication_count
container_cpu_usage_seconds_total
kubelet_volume_stats_available_bytes
container_fs_reads_bytes_total
container_fs_writes_bytes_total
container_network_transmit_bytes_total
container_network_receive_bytes_total
zeebe_process_instance_execution_time_bucket
zeebe_process_instance_execution_time_sum
zeebe_process_instance_execution_time_count
zeebe_job_activation_time_bucket
zeebe_job_life_time_bucket