Hi there,
We recently setup Zeebe in production with following configuration
Cluster: 5
Replicas: 3
Partitions: 16
Recently we added updated cluster from 4 to 5 and ran scale up api from Zeebe.
zbctl shows following
Cluster size: 5
Partitions count: 16
Replication factor: 3
Gateway version: 8.4.1
Brokers:
  Broker 0 - camunda-zeebe-0.camunda-zeebe.camunda.svc:26501
    Version: 8.4.1
    Partition 1 : Follower, Healthy
    Partition 4 : Follower, Healthy
    Partition 5 : Follower, Healthy
    Partition 6 : Follower, Healthy
    Partition 9 : Follower, Healthy
    Partition 10 : Follower, Healthy
    Partition 11 : Follower, Healthy
    Partition 14 : Follower, Healthy
    Partition 15 : Follower, Healthy
    Partition 16 : Follower, Healthy
  Broker 1 - camunda-zeebe-1.camunda-zeebe.camunda.svc:26501
    Version: 8.4.1
    Partition 1 : Leader, Healthy
    Partition 2 : Follower, Healthy
    Partition 5 : Follower, Healthy
    Partition 6 : Follower, Healthy
    Partition 7 : Follower, Healthy
    Partition 10 : Follower, Healthy
    Partition 11 : Leader, Healthy
    Partition 12 : Follower, Healthy
    Partition 15 : Follower, Healthy
    Partition 16 : Follower, Healthy
  Broker 2 - camunda-zeebe-2.camunda-zeebe.camunda.svc:26501
    Version: 8.4.1
    Partition 1 : Follower, Healthy
    Partition 2 : Leader, Healthy
    Partition 3 : Follower, Healthy
    Partition 6 : Leader, Healthy
    Partition 7 : Follower, Healthy
    Partition 8 : Follower, Healthy
    Partition 11 : Follower, Healthy
    Partition 12 : Leader, Healthy
    Partition 13 : Follower, Healthy
    Partition 16 : Leader, Healthy
  Broker 3 - camunda-zeebe-3.camunda-zeebe.camunda.svc:26501
    Version: 8.4.1
    Partition 2 : Follower, Healthy
    Partition 3 : Leader, Healthy
    Partition 4 : Leader, Healthy
    Partition 7 : Leader, Healthy
    Partition 8 : Follower, Healthy
    Partition 9 : Leader, Healthy
    Partition 12 : Follower, Healthy
    Partition 13 : Leader, Healthy
    Partition 14 : Leader, Healthy
  Broker 4 - camunda-zeebe-4.camunda-zeebe.camunda.svc:26501
    Version: 8.4.1
    Partition 3 : Follower, Healthy
    Partition 4 : Follower, Healthy
    Partition 5 : Leader, Healthy
    Partition 8 : Leader, Healthy
    Partition 9 : Follower, Healthy
    Partition 10 : Leader, Healthy
    Partition 13 : Follower, Healthy
    Partition 14 : Follower, Healthy
    Partition 15 : Leader, Healthy
But Grafana - promethues shows
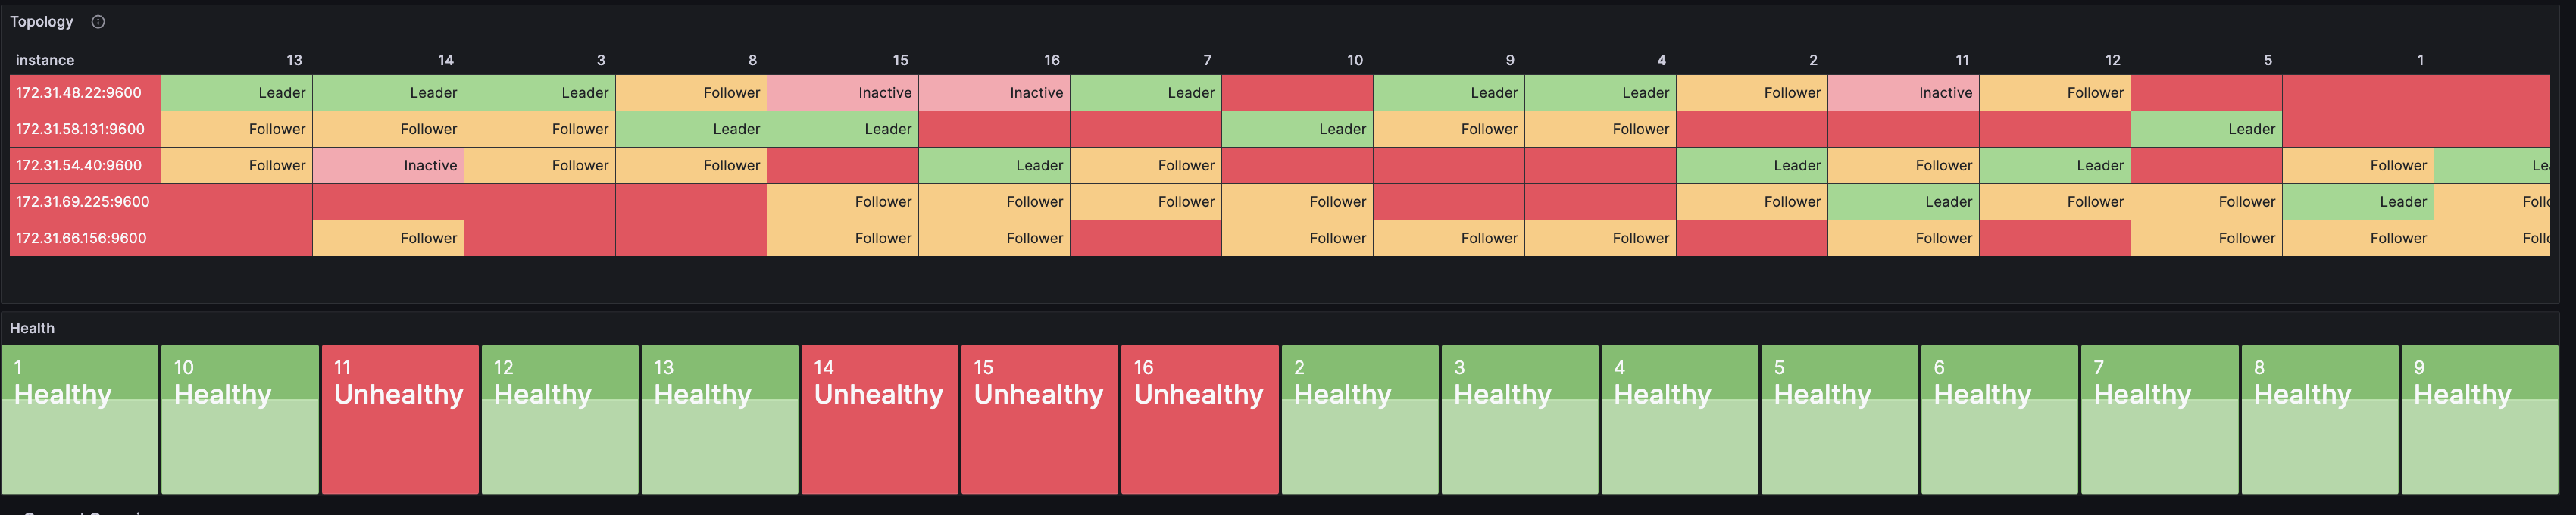
What are we missing? When cluster size was 4, we were getting all as healthy in Grafana but now story shows 4 partitions as unhealthy