Hello all
new plugin about to be released:
This plugin will replace the previous prometheus plugin:
Thanks for posting this Stephen!
looking forward to giving it a try
Thanks for this sharing @StephenOTT !
I took a look on your repository but is seems that your documentation process can’t be executed yet because there is no existing release and docker-compose file yet
Yes correct. A few adjustments before release. Today or tomorrow.
@canthony Jar has been released and instructions are updated.
Hi @StephenOTT @Niall
Thanks for the udpate.
I have a quick question regarding Telemetry configuration in Camunda and exporting data to Prometheus for Building Dashboard for BPMN process monitoring.
We are using Wildfly version of Camunda and running them on containers. We have enabled Multitenancy with different process engines pointing different SCHEMA under same Database.
we followed the below mentioned approach in our local machine and now able to see Prometheus in local on localhost:9404/metrics page.
we would like to know how can we export telemetry data to Prometheus for Higher regions like Dev, QC or PROD?
Is there any way to export data from Camunda to Prometheus by calling Rest API?
We heard the data Prometheus exporting happens every 24 hrs. in Camunda? Is this true? If yes then how can we change it to 15 mins?
We really appreciate your help!
Thanks,
Jagadish
@JagadishL this question would be better asked in a different thread. You are asking about JMX metrics and the Camunda docker setup. This thread is more focused on the process engine plug-in for business metric monitoring.
Hi @StephenOTT
Thanks for your reply. I will post this question on new thread.
Additional default metrics have been added:
Part of CamundaMonitoringMetrics.groovy
Grafana dashboard has been added to the repo and added sample prometheus+grafana setup as part of the default docker setup.
@StephenOTT:
thanks for your project.
we are using camunda Run for enterprise, how can we use it as a lib (add to userlib and configure file production.yml )
Thanks!
Hi @StephenOTT
I am quite a newbie for Camunda.
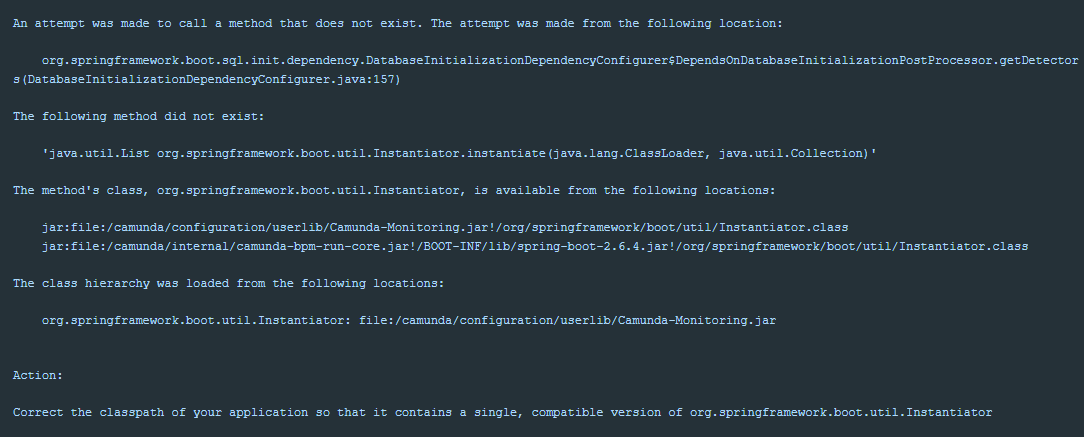
Thanks a lot for your contribution but I got error when performing docker-compose
The error is spring boot dependencies.
Could you help to figure it out for me?
I am facing the exact same error. I copied the CamundaMonitoring.jar in the userlib, did the necessary default.yml changes, changes to camunda-monitoring-beans.xml
Seems like the CamundaMonitoring.jar also includes the springframework/boot core files, that are already present in the camunda-run distributable.
Please help.
@StephenOTT I am using camunda 7 helm chart
Using image in Docker, tag: tomcat-7.18.0
I am not a java developer and I just want a quick way to add monitoring. I am kind of lost in the files here in the readme: GitHub - StephenOTT/Camunda-Monitoring: Monitor anything you can query in a Camunda BPM engine. Monitor KPIs, metrics, and any business performance
would it be possible to tell me the steps? sorry for the hassle.