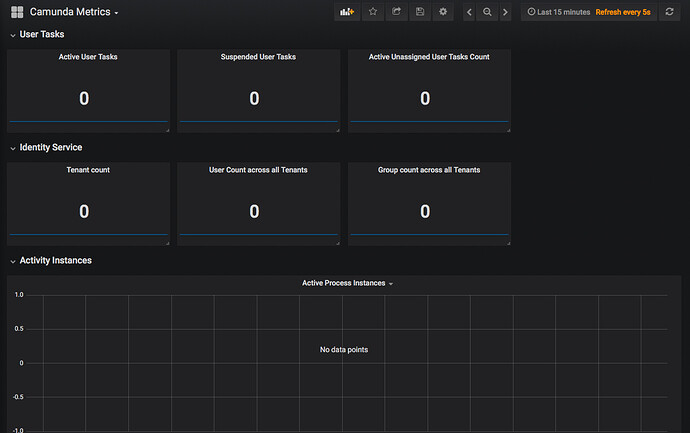
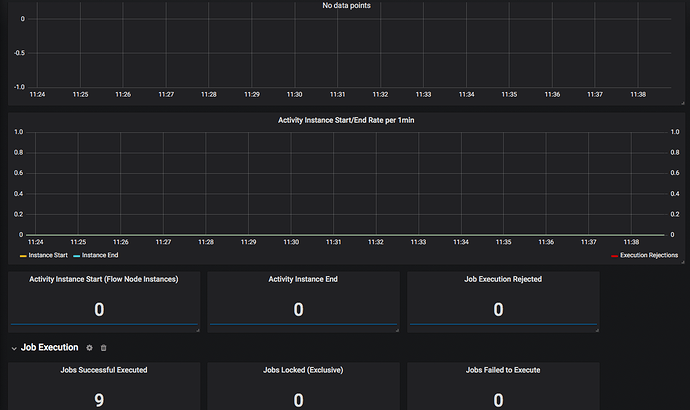
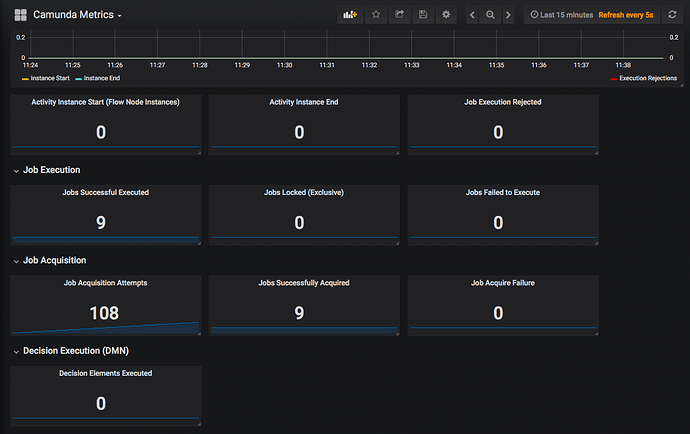
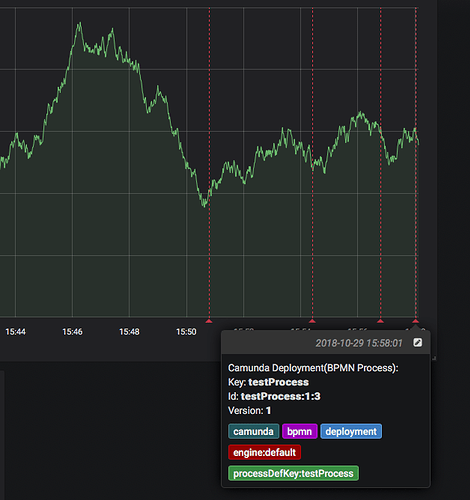
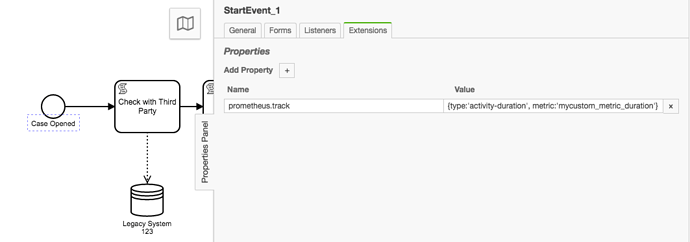
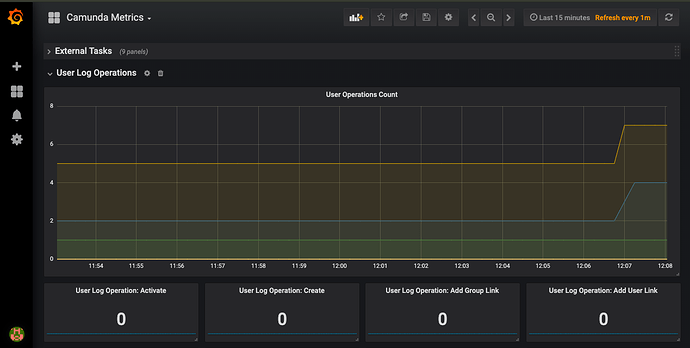
Hey
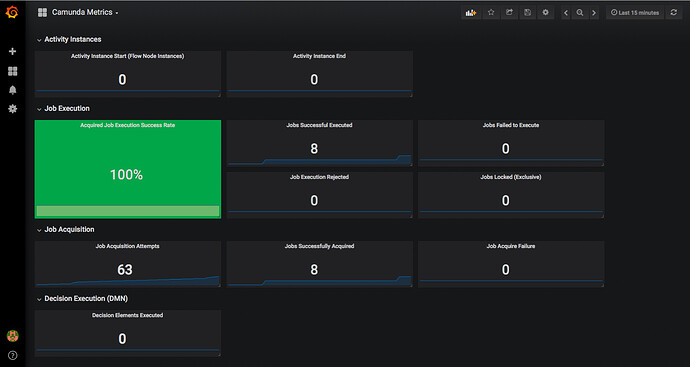
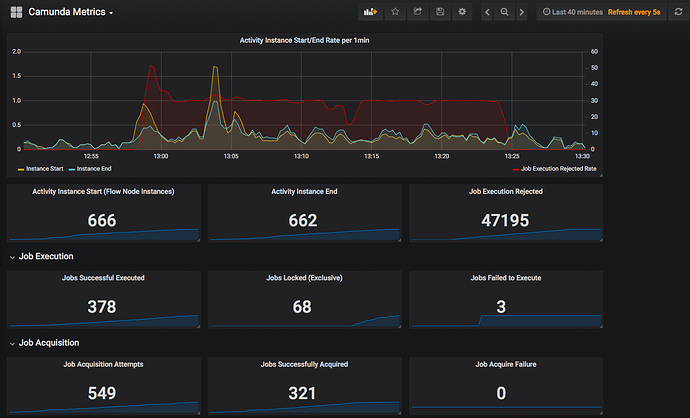
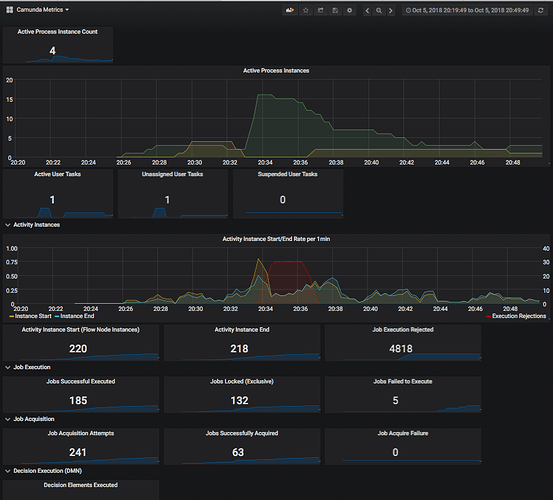
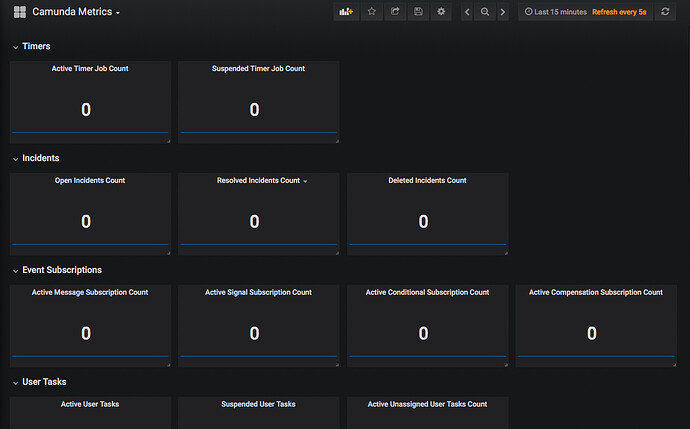
Wanted to share the above.
It was a small plugin i put together that enables Prometheus metrics reporting, but the extra “flavour” is you can use the metrics system to generate “business centric” metrics that are generated through the bpmn’s dmn’s, and cmmn’s usage.
few examples:
import io.digitalstate.camunda.prometheus.collectors.SimpleGaugeMetric;

def openCases = new SimpleGaugeMetric('open_cases', 'Number of Open Cases, labeled by Case Type', ['type'])

openCases.increment(['standard'])
import io.digitalstate.camunda.prometheus.collectors.SimpleHistogramMetric

def httpRequest = new SimpleHistogramMetric('legacy_system_123_request', 'Connection duration time, labeled by HTTP Method', null, ['method'])

httpRequest.startTimer(['POST'])

sleep(Math.abs(new Random().nextInt() % 5000) + 650) // Simulates a delay

httpRequest.observeDuration()
import io.digitalstate.camunda.prometheus.collectors.SimpleGaugeMetric

def money = new SimpleGaugeMetric('money_collected', 'dollar values collected, labeled by form of payment', ['payment_form'])

def amount = Math.abs(new Random().nextDouble() % 284.03) + 23.54 // Random dollar value
money.increment(amount, ['credit-card'])
import io.digitalstate.camunda.prometheus.collectors.SimpleGaugeMetric

def openCases = new SimpleGaugeMetric('open_cases')

openCases.decrement(['standard'])

def closedCases = new SimpleGaugeMetric('closed_cases', 'Number of Open Cases, labeled by Case Type', ['type'])
closedCases.increment(['standard'])
You can also setup internal recurring API queries that generate the metrics so certain queries that are run continually can be done with the java api rather than using black-box exporter.
All the data easily ends up in Prometheus and can be visualized with grafana!
Enjoy
